
Bitcoin price trades at $73,469 ahead of June 2026 as institutions close May on the biggest monthly ETF outflow of 2026, with whales and long-term holders also starting to distribute.
The setup hints at a possible defiance of June’s historically positive median return for Bitcoin. The chart structure now decides whether seasonal buyers or distribution sellers control the next month.
May ETF Outflows Break Bitcoin’s Two-Month Inflow Pattern
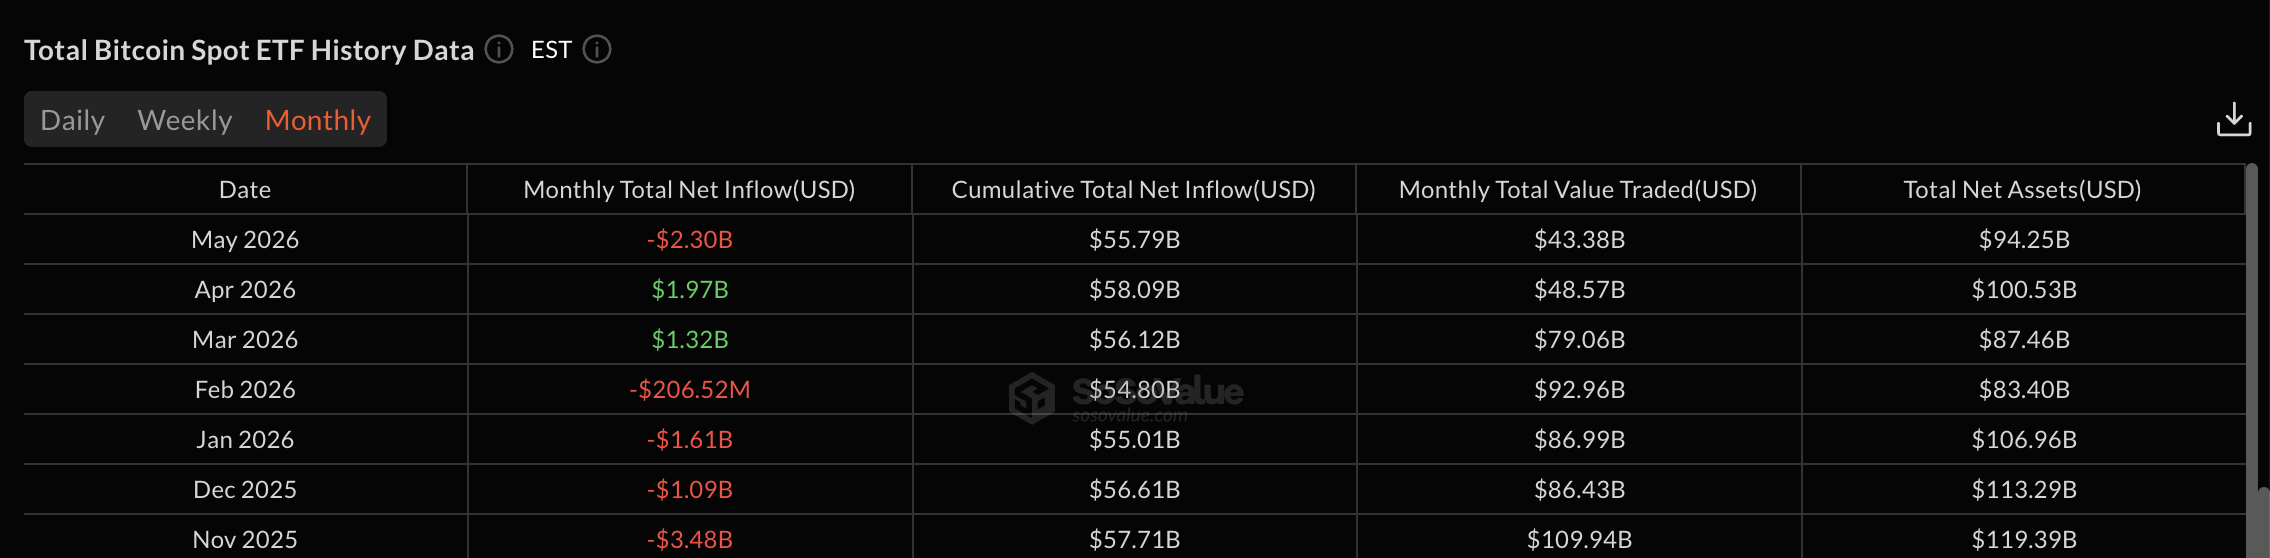
Bitcoin spot ETFs closed May with $2.30 billion in net outflows. The figure is the largest monthly outflow of 2026 and the steepest since November 2025.

This reverses two consecutive months of green. April added $1.97 billion and March added $1.32 billion in net inflows.
Want more token insights like this? Sign up for Editor Harsh Notariya’s Daily Crypto Newsletter here.
The size of the May exit stands out. Bitcoin fell only 3.69% in May, yet the outflow is roughly 10 times bigger than February’s $206 million net redemption. February saw Bitcoin drop 14.8%.
Institutions appear to be derisking faster than price weakness alone would suggest. The cumulative net inflow has slipped to $55.79 billion from $58.09 billion in April. History points in the opposite direction. The June median Bitcoin return is +2.58%, with only five red Junes in the past twelve years.

The mismatch between heavy ETF selling and a historically positive month sets the central tension for this Bitcoin price prediction. The price chart structure is the next test of whether sellers or seasonal buyers win.
Rising Channel After 38% Drop Risks a Bearish Breakdown
Bitcoin has been moving inside a rising channel pattern on the three-day chart since February 6, 2026. The channel formed immediately after a sharp 38.63% drop from the January 13 high.
A rising channel following a steep drop is typically a continuation pattern and not outright bullish. It tends to resolve to the downside unless the upper trendline is broken cleanly.
Bitcoin tried that breakout in early May. The price tested the upper trendline before rejecting and rolling over since.

Price action has lost both the 20-period and 50-period exponential moving averages (EMA). An EMA smooths recent price action with more weight on the latest periods.
The bigger risk now sits with the longer-term averages. The 100-period EMA is closing in on the 200-period EMA on the same three-day chart.
A crossover would mark a longer-term bearish trend shift. The setup suggests the lower channel trendline could be the next test if buyers fail to defend price soon. This makes the onchain behavior of large holders the next variable to watch.
Whales and Long-Term Holders Are Distributing
Onchain data appears to confirm the institutional caution. The number of Bitcoin whales with 1,000 BTC or more peaked at 1,285 entities on May 22, according to Glassnode.
That count has since dropped to 1,279 by May 28. The loss of six entities represents at least 6,000 BTC distributed in roughly one week. At current prices, that is close to $440 million in concentrated selling.

Long-term holders are also stepping back. The Hodler Net Position Change tracks net buying or selling by addresses holding coins for 155 days or more.
The reading peaked at 42,301 BTC on May 24. By May 28, it had fallen 7.69% to 39,049 BTC. The drop suggests the strongest hands are quietly trimming positions ahead of June.

This pattern aligns with analyst Benjamin Cowen’s view that Bitcoin’s cycle bottom is still ahead. Cowen places a probability on a new low in 2026, with October as his base case.
ETF buyers, whales, and long-term holders are reducing exposure at the same time. That makes the BTC price chart the decider for the June outlook.
Bitcoin Price Prediction and Key Levels to Watch for June 2026
The next move for Bitcoin price depends on one immediate level. Bitcoin needs to reclaim $73,869, the 0.236 Fibonacci level, on a three-day close to neutralize the bearish setup. The 0.236 level is the first pullback line that Bitcoin lost in the recent decline.
A reclaim opens the path to $77,877, a three-day structural resistance. Above that, Bitcoin can attempt to retest the upper channel resistance at $82,785, where the early May rejection happened.
Failure to reclaim $73,869 puts the lower channel trendline at $70,342 in play. A breakdown below $70,342 exposes the 0.382 Fibonacci level at $68,348, a roughly 7% slide from current price.

Continued weakness then opens deeper Fibonacci levels at $63,886 and $59,424. A confirmed 100-period and 200-period EMA crossover could accelerate the move toward these zones.
The June outlook hinges on one number. The $73,869 reclaim separates a rising channel that survives June from a continuation breakdown that could break Bitcoin’s historically positive median return for the month.
The post Bitcoin Price Prediction for June 2026: Institutional Exodus Foreshadows a Crash? appeared first on BeInCrypto.
Trading,Bitcoin (BTC) Analysis,Bitcoin (BTC) News,Editor’s Pick#Bitcoin #Price #Prediction #June #Institutional #Exodus #Foreshadows #Crash1780041716