
XRP has spent years losing ground against NVIDIA, one of the strongest assets in global markets. Now, a widely shared analyst chart suggests a break above a long-running resistance line could mark the start of XRP’s next major move.
The setup sounds bullish, but the history is less convincing. BeInCrypto rebuilt the XRP-to-NVIDIA comparison and tested past breakouts. Since 2021, those breaks have usually marked exhaustion, with XRP falling sharply afterward.
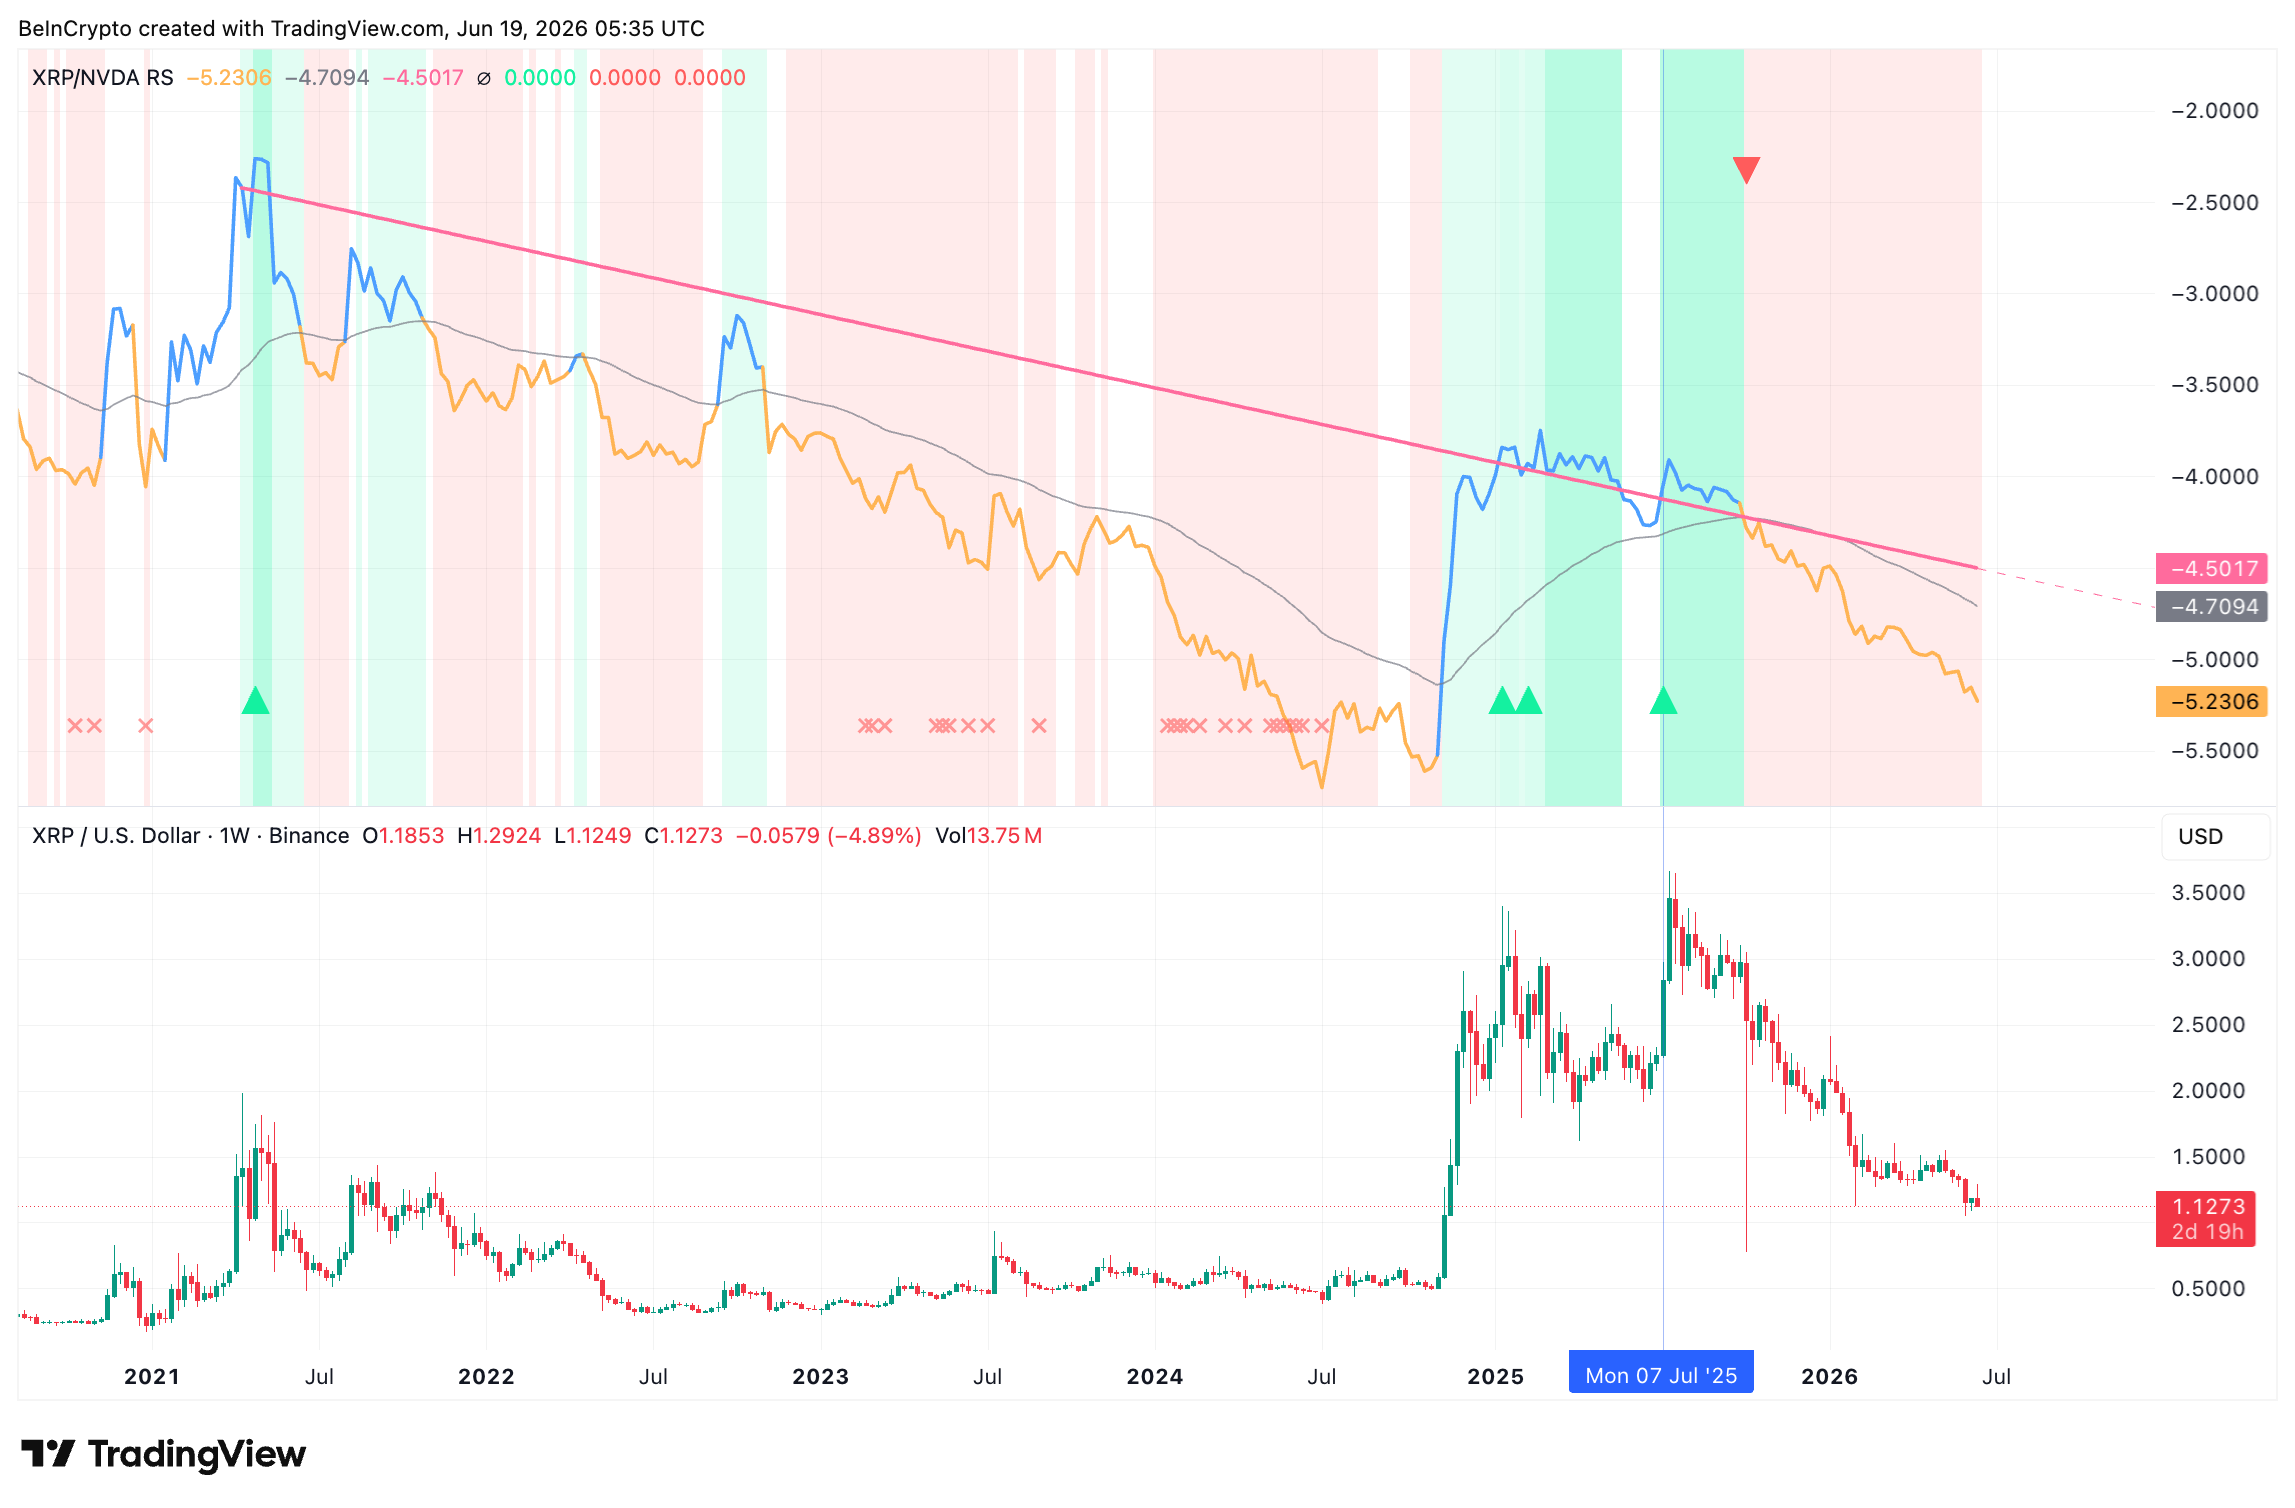
XRP Bleeds Against NVIDIA on a Long Falling Line
The following chart shows XRP’s relative strength, which means XRP’s price divided by NVIDIA’s price. When the line rises, XRP is winning. When it falls, XRP is losing.
Want more token insights like this? Sign up for Editor Harsh Notariya’s Daily Crypto Newsletter here.
For years, that line has dropped. Cryptollica marks a long descending resistance and argues that a break starts XRP’s real move. The 2018, 2021, and 2025 peaks all stalled there. It wasn’t until 2017 that a break occurred, pushing XRP higher.
A real breakout should also hold on a slower chart. So, BeInCrypto tested the idea on weekly closes, not the analyst’s five-day chart. A weekly relative strength move is harder to fake.
The rule was simple. BeInCrypto drew one descending line across the same relative-strength highs the analyst marks. His chart runs back to 2018, but this weekly view starts in 2021 and includes all the breaks. Price then sits above or below the line on its own.
A break counts when a weekly close finishes above that line. After each break, BeInCrypto measured XRP’s return over the next twelve weeks. That left four breaks since 2021, and each now needs a verdict.
Every Break Has Marked a Top, Not a Launch
So far, the pattern lacks conviction. All four breaks led to sharp drops from the peak rather than fresh rallies. Twelve weeks after a break, XRP fell a median 39%.

Two numbers show how reliable that was. The hit rate is the share of breaks that ended higher, and each window is measured separately. So one break can be up at one mark and down at the next.
That is why the readings differ. One of four breaks was up at four weeks. None were up at twelve weeks. One had recovered by twenty-six weeks. Twelve weeks is the washout low, where every break was underwater, so the piece uses that mark.
The base rate is the other number. A normal twelve-week stretch, any random period with no break, returned about negative 2%. Because the breaks did far worse, the break behaves like exhaustion rather than ignition.

Next, BeInCrypto checked whether NVIDIA is special. The test looks for a falling relative-strength line, meaning years of XRP steadily losing to an asset. XRP shows that falling line against only NVIDIA and Bitcoin. The S&P 500, the Nasdaq, and gold do not.
So only NVIDIA and Bitcoin match the analyst’s setup. A break against the S&P 500 preceded a 35% gain, yet the S&P has no falling line. Therefore, that number is not a fair comparison here.

Among the two that qualify, the gap is stark. A Bitcoin break preceded a small 5% rise. However, the NVIDIA break preceded a 39% drop. So the damage is unique to NVIDIA, even versus the only other asset with the same setup.
That record raises one question. Why did the most recent break fail so cleanly?
On-Chain Data Shows Why One of the Breaks Failed
The answer sits on the XRP Ledger. Around early July 2025, the XRP exchange net position change turned sharply positive. That metric tracks coins moving in and out of exchanges, and rising inflows often signal selling pressure.
This shift happened near XRP’s mid-2025 peak above $3. So holders appear to have moved coins onto exchanges to sell into the strength.

The next metric tells the same story. The XRP hodler net position change turned negative around July 17. It tracks whether long-term holders are adding or reducing coins, and it stayed red through August.
That timing matters. Because even high-conviction holders sold during the correction, the break appears to have lacked underlying demand.

On-chain weakness explained the last failure. So the next break needs the opposite signal.
What XRP Price Needs Before the Next Break Counts
Here is the catch for bulls. XRP must rise by about 459% against NVIDIA just to reach the line again, per the 7-day chart calculations. So, a break is nowhere close today.

Even a clean break alone would not be enough.
Instead, it would need continuous on-chain support, such as steady exchange outflows and holder accumulation.
Encouragingly, recent flows have turned more constructive. Coins have left exchanges lately, and long-term holders have started adding again. Still, XRP price near $1.16 sits far below its old highs.
History offers one caution, too. On the analyst’s chart, 2017 was the only break that truly worked. However, XRP was a micro-cap then, and NVIDIA was a fraction of today’s size. That single win came from a market that no longer exists.
So, What Do All of These Mean? Is XRP Bullish?
XRP has been losing badly against NVIDIA for years. Some analysts say XRP could finally rally if it breaks above a long-term comparison line, but BeInCrypto’s test shows the opposite has happened since 2021.
Every time XRP broke that line against NVIDIA, it usually marked a short-term top, followed by a sharp drop. The last failed breakout was likely because holders moved XRP to exchanges and sold.
For a real bullish signal, XRP would need much stronger demand, fewer coins moving to exchanges, and long-term holders buying again. Right now, the breakout is still far away.
The post XRP Has an NVIDIA Connection, But is It Strong Enough This Cycle? appeared first on BeInCrypto.
Trading,Altcoin Analysis,Editor’s Pick,Ripple (XRP) Analysis#XRP #NVIDIA #Connection #Strong #Cycle1781886313
