
Key Takeaways
- Gold fell 1.6% to about $4,110 as Iran halted its ceasefire on July 8, 2026.
- Silver dropped 4.3% to $59.70, with the FOMC minutes showing a split Fed on rate hikes.
- The BLS reported just 57,000 June jobs, and traders now watch CPI data for the next Fed signal.
Spot gold started the week near $4,175 an ounce. Futures pushed as high as $4,215.50 on Monday after the Bureau of Labor Statistics reported just 57,000 nonfarm payrolls added in June, well below the roughly 110,000 economists expected. The BLS also cut its April and May job totals by a combined 74,000. Unemployment ticked up to 4.2%.
Traders read the weak jobs print as a sign that the Federal Reserve would move closer to cutting interest rates. The dollar weakened against major currencies. Gold and silver both climbed into the holiday-shortened week, with silver touching $62.80 an ounce and gold trading above $4,200.

The rally did not last. President Trump stated on July 8 that a fragile ceasefire with Iran was over. Renewed strikes tied to shipping in the Strait of Hormuz followed, and oil prices jumped on fears of a wider disruption. Higher oil prices pushed up inflation expectations, and Treasury yields rose along with them.
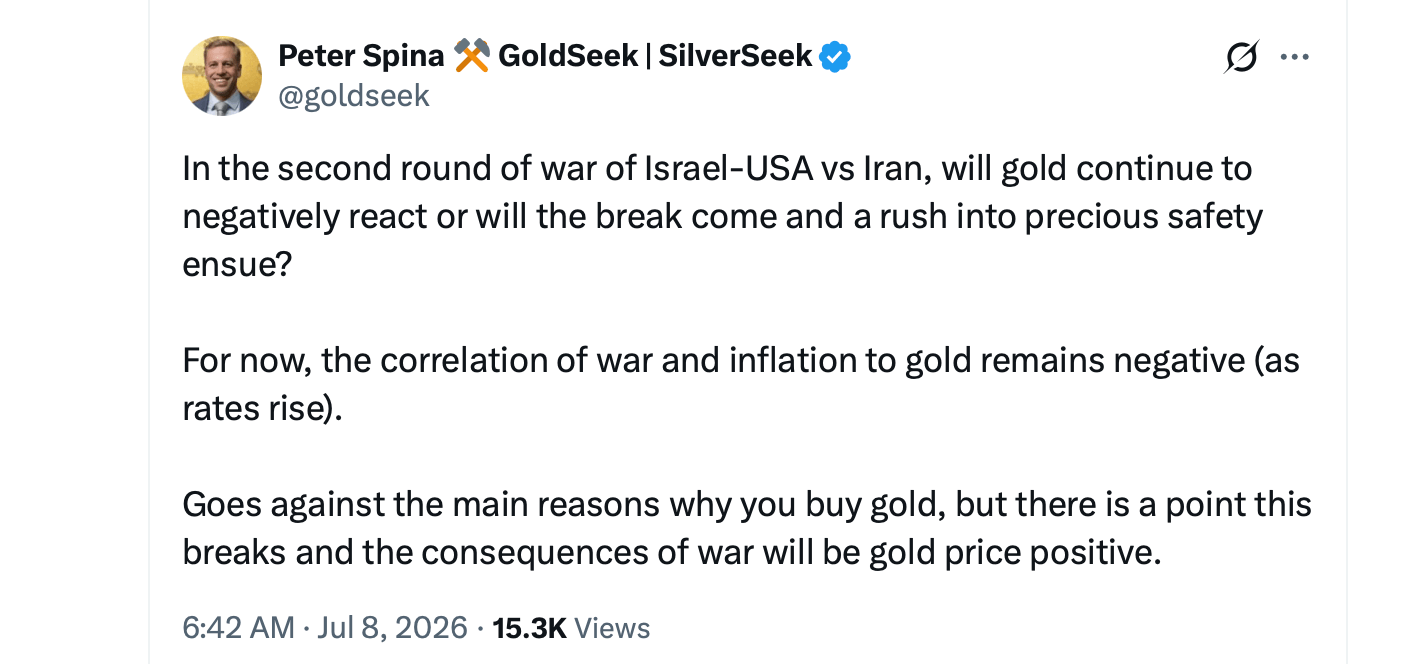
Gold futures fell from an open near $4,106.50 to an intraday low of $4,032.50 that same day, a drop of close to 2%. Silver fell harder. Futures closed down 4.55% at $58.54, based on data from COMEX. Spot silver briefly traded near $58 an ounce during the session. Two days later, on July 10, Trump warned Iran of more military action.
“Orders have already been given, and the U.S. Military is ready, willing, and able, for a one year period of time, subject to extension, to completely decimate and destroy all areas of Iran,” Trump wrote on Truth Social.
The Federal Open Market Committee (FOMC) released its June meeting minutes the same day. The minutes showed a divided committee still focused on inflation that has not fully cooled. That kept the odds of a September rate hike near 50%, according to market pricing cited in the report, and added to the pressure on both metals just as the Iran news hit.
Physical Buyers Step In
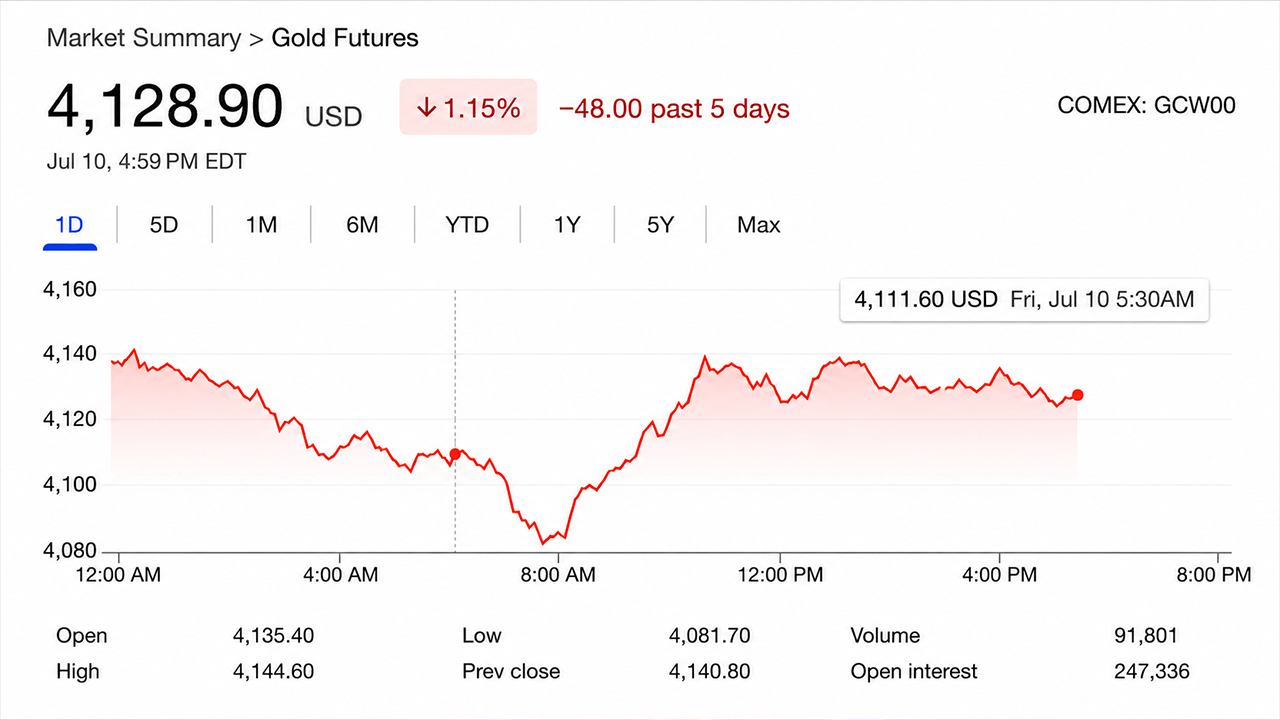
Gold and silver both bounced back on July 9. Gold futures rose 1.43% to close at $4,140.80. Silver climbed 3.77% to about $60.75. Traders and dealers pointed to physical buying, meaning purchases of actual bars and coins rather than paper futures contracts, as the reason prices held near $4,030 to $4,080 instead of falling further.
Premiums in physical hubs including Dubai, Shanghai, and India firmed during the dip, a sign that demand for the metal itself outpaced the selling pressure in futures markets. Analysts at USAGOLD and Bullionvault described the pattern as bargain hunting near key psychological price levels.
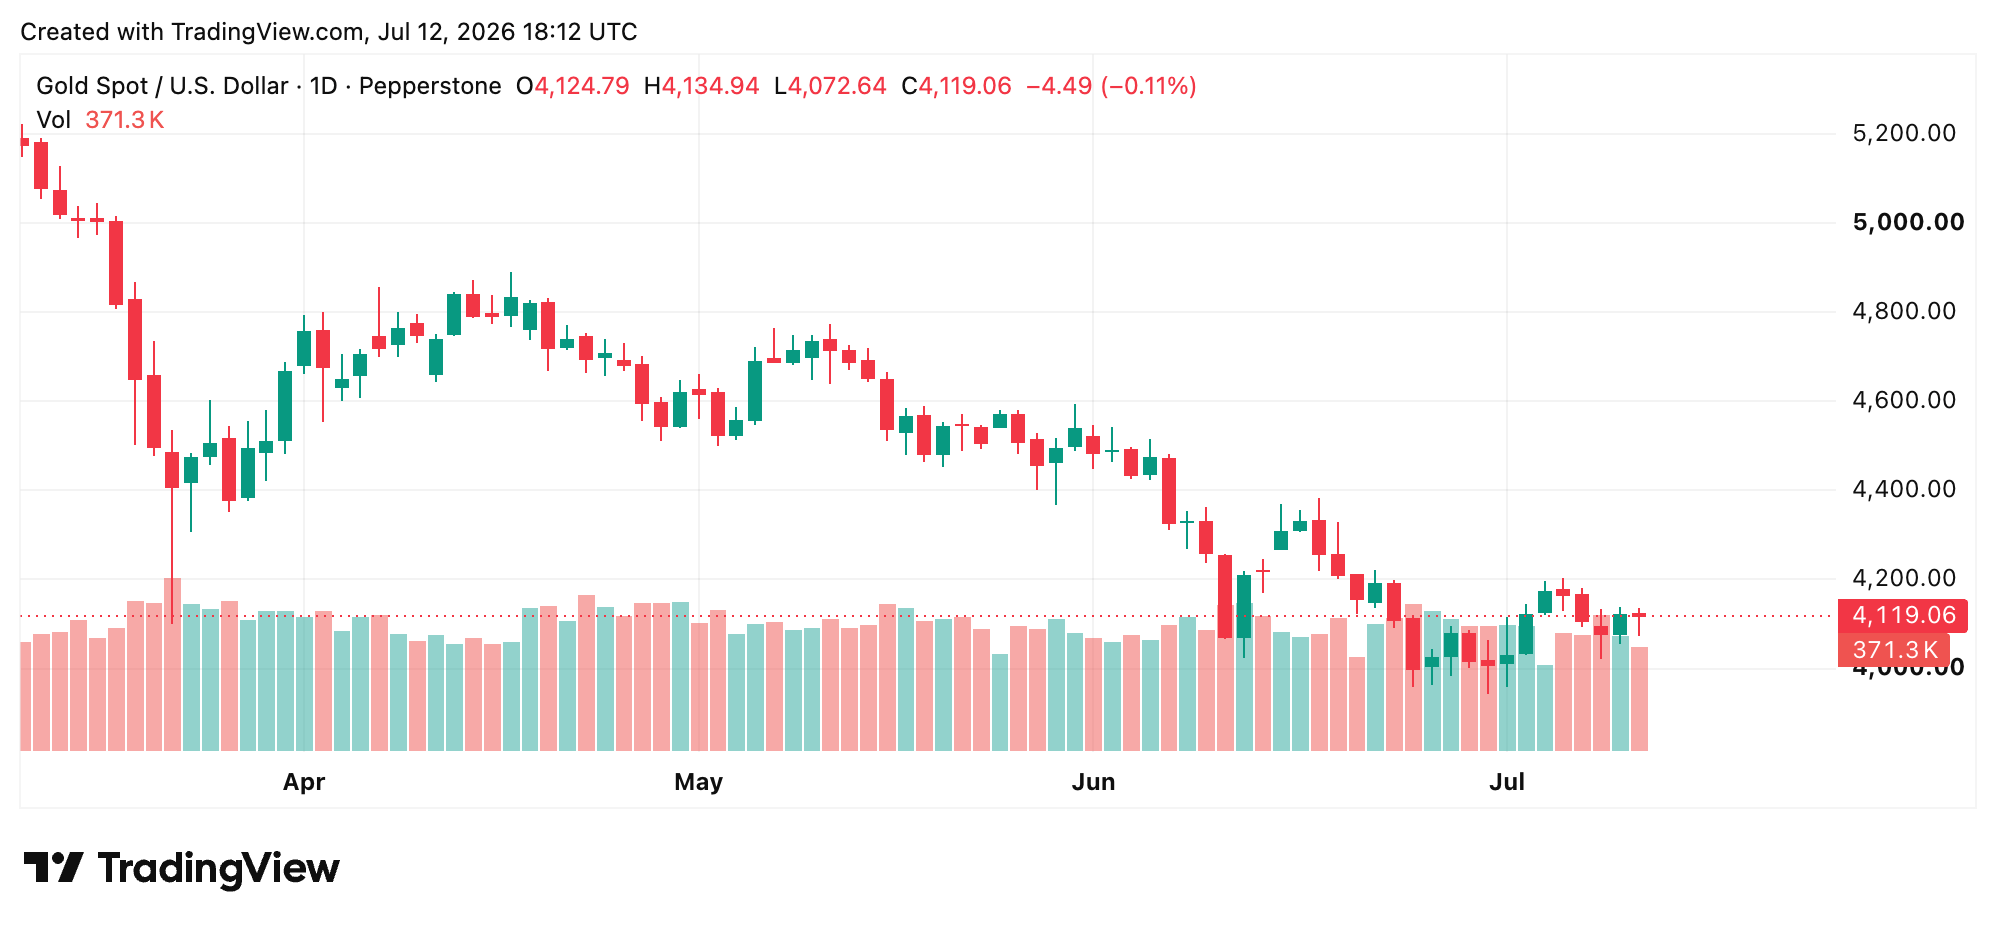
Friday brought a quieter session. Gold futures slipped about 0.65% to close at $4,113.70, while silver eased 0.96% to $60.17. Weekend trading stayed thin, with spot gold settling between $4,108 and $4,120 and spot silver near $59.70 to $59.75 heading into the new week.
Gold closed out the week down 1.3% to 1.6% from its July 5 starting point. Silver ended closer to $59.70, down roughly 4.3% over the same stretch.
Why Silver Fell Harder
Silver moves more than gold in both directions because more than half of silver demand comes from industrial uses like electronics, solar panels, and electric vehicles, not just investment. When growth fears rise alongside inflation fears, as they did after the Iran news, silver gets hit from two sides at once.
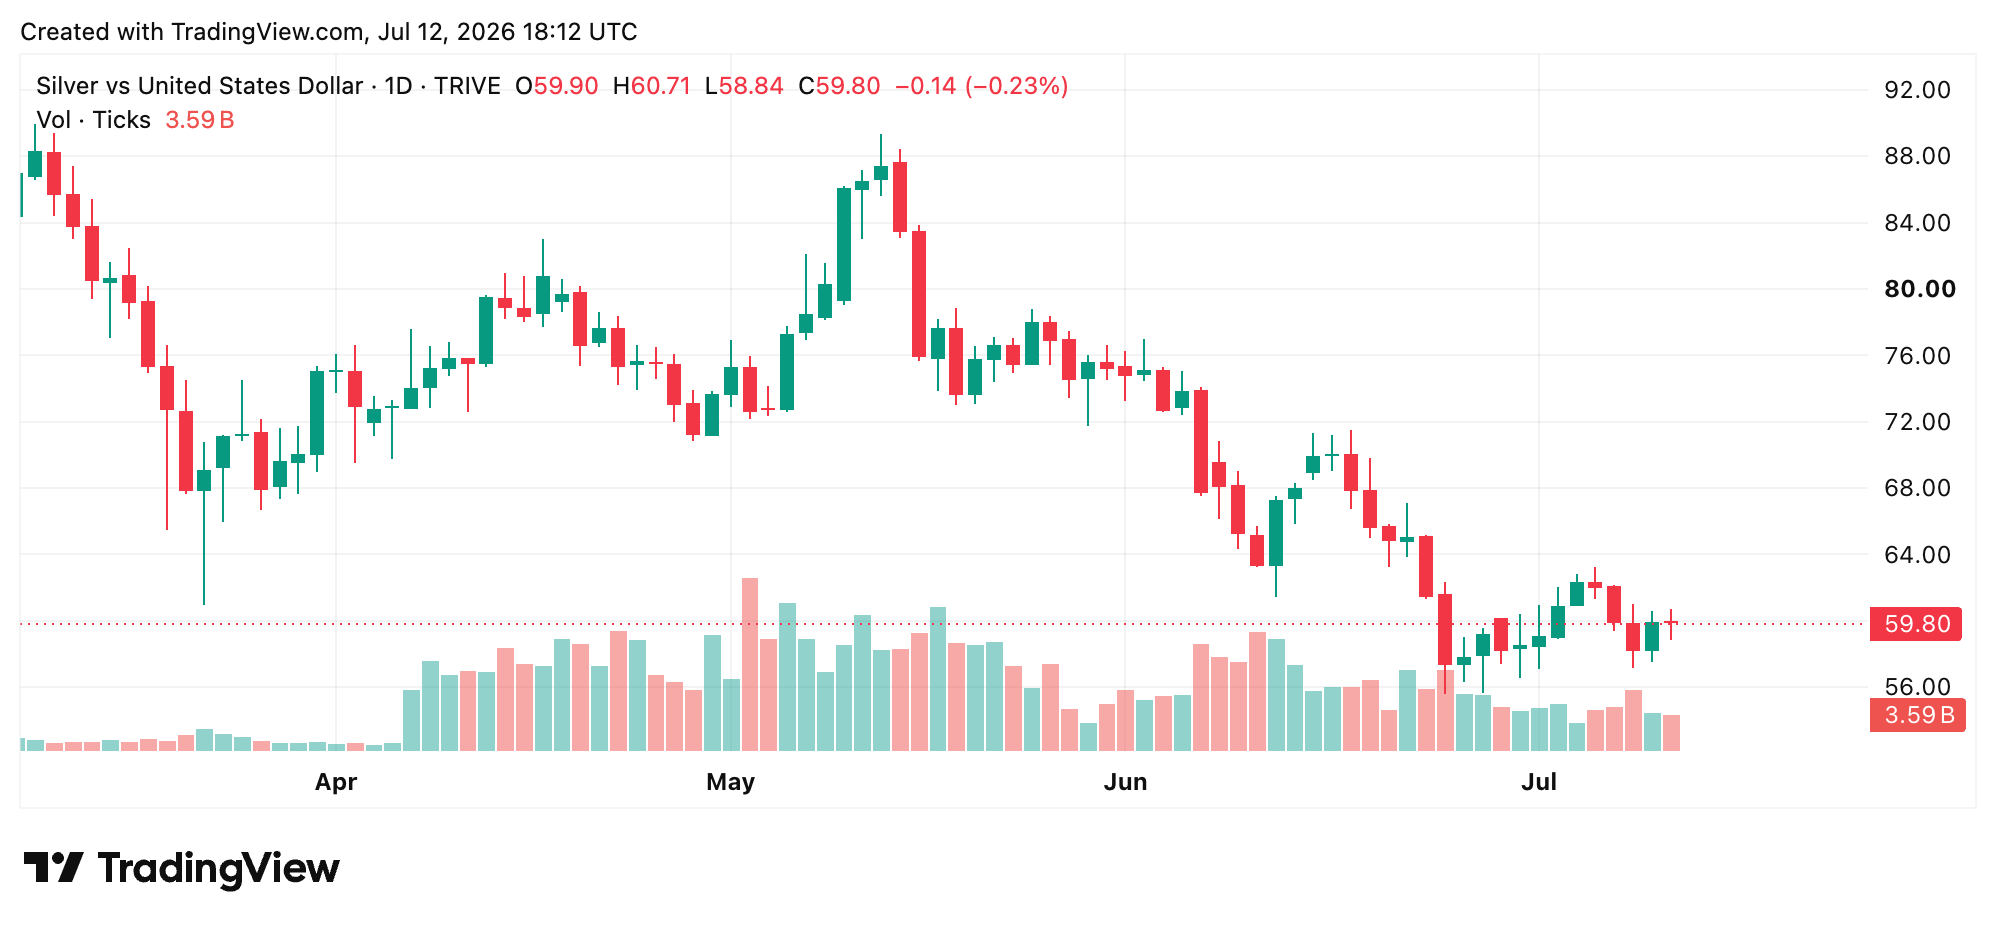
The gold-to-silver ratio, which measures how many ounces of silver it takes to buy one ounce of gold, widened during the July 8 selloff and settled in the 67 to 70 range by the weekend. A wider ratio means silver underperformed gold on a relative basis over the week.
Gold tested support near the $4,000 to $4,100 range multiple times without breaking down, with physical buying cited repeatedly as the floor beneath the market. Resistance showed up between $4,150 and $4,200, a zone gold approached but failed to clear after Monday’s early spike.
What Comes Next
Markets are now watching the next Consumer Price Index (CPI) report for confirmation on where inflation actually stands. That data will help traders decide whether the Fed’s September meeting brings a rate cut, a rate hike, or no change at all.
Central bank gold buying remained a background support through the week, along with the physical demand that limited losses compared with past selloffs. Gold remains down sharply from highs above $5,300 reached earlier in 2026, but the July pullback stayed shallow next to that broader correction.
For now, gold and silver traders are pricing in two competing forces. A weaker labor market points toward lower rates and higher metal prices. A wider Middle East conflict points toward higher oil, higher inflation, and higher bond yields, all of which work against gold and silver. Until one force clearly wins out, both metals are likely to keep swinging between the two.
Market Updates,gold,market updates,markets and prices,Precious Metals,silvergold,market updates,markets and prices,Precious Metals,silver#Gold #Prices #Slide #Iran #Tensions #Erase #Weak #Jobs #Report #Rally #Gains1783889718