
Ether (ETH) has surged more than 10% in April, reaching as high as $2,430 this month amid renewed market optimism.
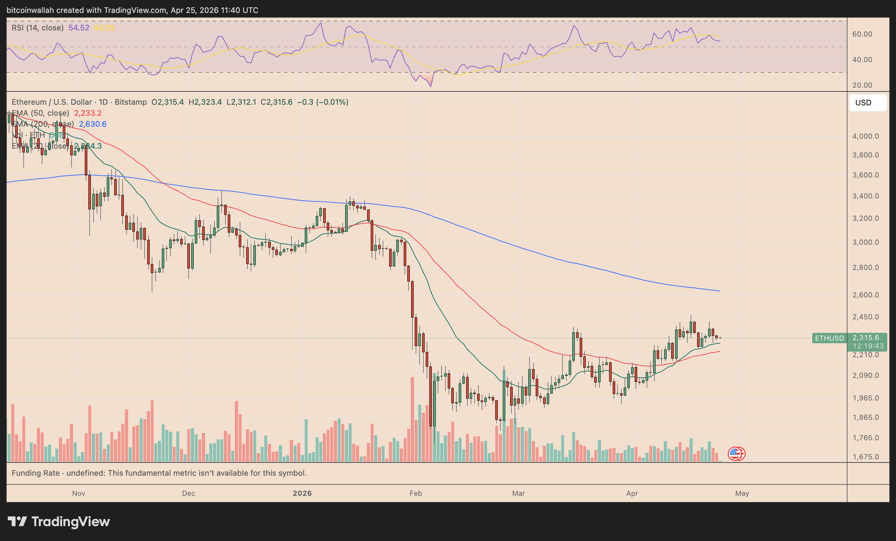
ETH/USD daily chart. Source: TradingView
Yet during the same period, the Ethereum Foundation, a nonprofit overseeing the Ethereum protocol’s development, has continued notable treasury sales.
Key takeaways:
- The Ethereum Foundation has sold approximately 20,000 ETH so far in 2026.
- Institutional demand for ETH remains strong, offsetting the foundation’s impact on the market.
Why is the Ethereum Foundation selling ETH?
In early April, the Foundation sold 5,000 ETH for roughly $11 million in DAI. This was followed by a larger 10,000 ETH OTC sale to Tom Lee’s Bitmine at an average price of $2,387, raising approximately $23.9 million.
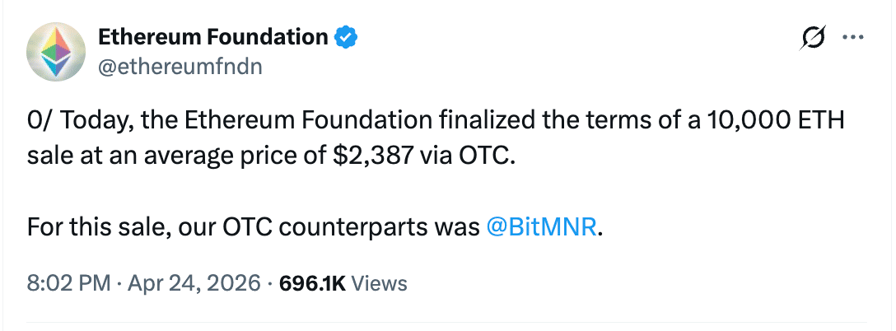
Source: X
The sales are not reactions to price action but follow a disciplined Treasury Policy adopted in June 2025.
The Foundation maintains fiat and stablecoin reserves equal to roughly 2.5 years of operating expenses. Periodic ETH sales replenish these reserves to fund protocol development, research, grants, and ecosystem support.
In 2026 alone, the Foundation has sold approximately 20,000 ETH, raising over $45 million. It still holds around 92,500 ETH (~$215 million) in its liquid treasury, plus 53,000 ETH staked, according to data resource Arkham Intelligence.
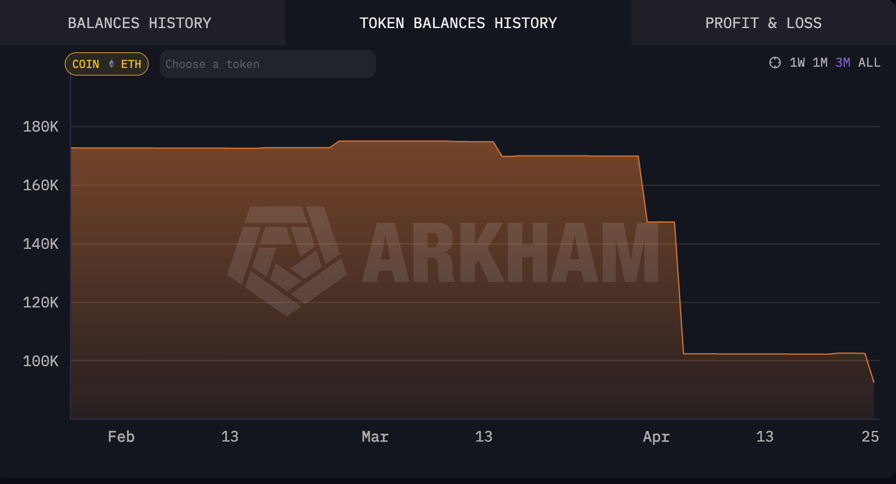
Ethereum Foundation’s ETH balance. Source: Arkham Intelligence
The Foundation’s 53,000 staked ETH may generate $4–$5 million in annual yield, assuming the current ETH price and the annual percentage yield of approximately 2.7%–3.8% gross remains about the same or higher in the future.
This new income stream should gradually reduce the Foundation’s reliance on ETH sales to fund its operations.
Are Ethereum Foundation’s sales bearish for ETH?
The Ethereum Foundation’s ETH sales remain small relative to daily ETH volume.
A typical 5,000–10,000 ETH sale represents just 0.08%–0.25% of Ethereum’s average daily trading volume of $10–12 billion.
This modest size means the market can comfortably absorb the Foundation’s selling pressure with negligible impact.
On-chain data already highlights robust underlying demand for ETH from large holders.
For instance, the number of daily accumulation addresses, wallets steadily buying and holding Ether, rose to 2,434 this week, surpassing the number of exchange depositing addresses (wallets preparing to sell), which fell to 2,300, as shown below.
Binance ERC-20 stablecoin whale activity index. Source: CryptoQuant
Also, spot Ethereum ETFs have recorded strong inflows for three consecutive weeks, attracting more than $2 billion in new capital since early April, according to data from SoSoValue.
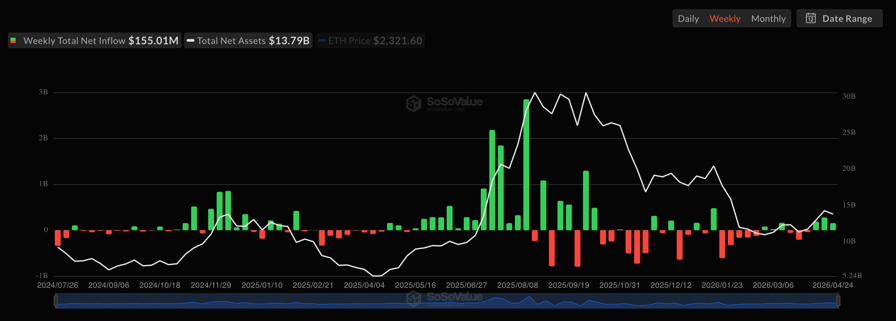
US spot Ethereum ETF weekly flows. Source: SoSoValue
This sustained institutional buying signals growing demand for Ethereum investment products on Wall Street.
Ether’s rising wedge hints at 15% dip ahead
From a technical perspective, Ether is currently forming a rising wedge pattern, a structure defined by two ascending trend lines that are converging, accompanied by noticeably declining volume.
In technical analysis, a rising wedge resolves when the price breaks below the lower trend line and falls by as much as the structure’s maximum height.
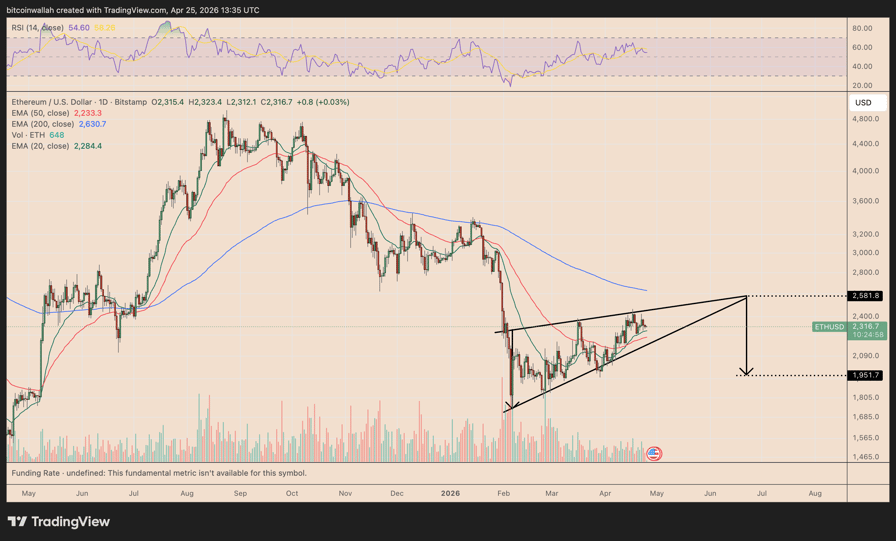
ETH/USD daily chart. Source: TradingView
Applying this rule to ETH’s chart brings its downside target to around $1,950, down by over 15%, by June, assuming the breakdown point is the wedge’s apex at approximately $2,580, where the two trend lines converge.
Related: Ethereum whale opens $90M long bets as ETH price chart eyes $3.2K
Conversely, a break above the wedge’s upper trendline may invalidate the bearish outlook. Instead, bulls may target the 200-day exponential moving average (200-day EMA, the blue line) at around $2,630 as their next upside target.
Market Analysis#ETH #price #April #Ethereum #Foundation #selling1777312597
