
Bitcoin (BTC) eyed $77,500 on Friday after US stocks posted fresh record highs on strong tech earnings.
Key points:
- Bitcoin continues a rebound after the monthly close as stocks hit record highs.
- Strong tech earnings propel the S&P 500 over 7,200 points for the first time in history.
- PCE inflation data nears its highest levels in three years, prompting speculation about next month’s numbers.
Bitcoin creeps higher while S&P 500 makes history
Data from TradingView showed near 12% April BTC price gains as risk assets ignored rising US inflation signs.
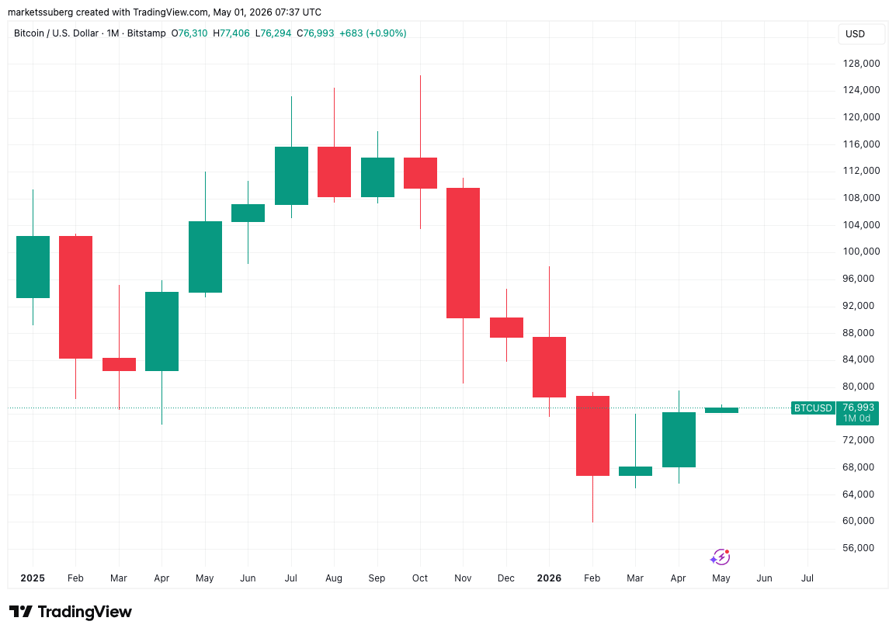
BTC/USD one-month chart. Source: Cointelegraph/TradingView
The S&P 500 reached nearly 7,220 points before closing ten points lower, propelled by stronger-than-expected earnings from Google and Apple.
Reacting on X, trading resource The Kobeissi Letter noted that the S&P had added over $8 trillion in market cap since hitting local lows at the end of March.
“A year ago it was at 5,600. 5 years ago it was at 4,200. 10 years ago it was at 2,100,” Charlie Bilello, chief market strategist at wealth manager Creative Planning, added.
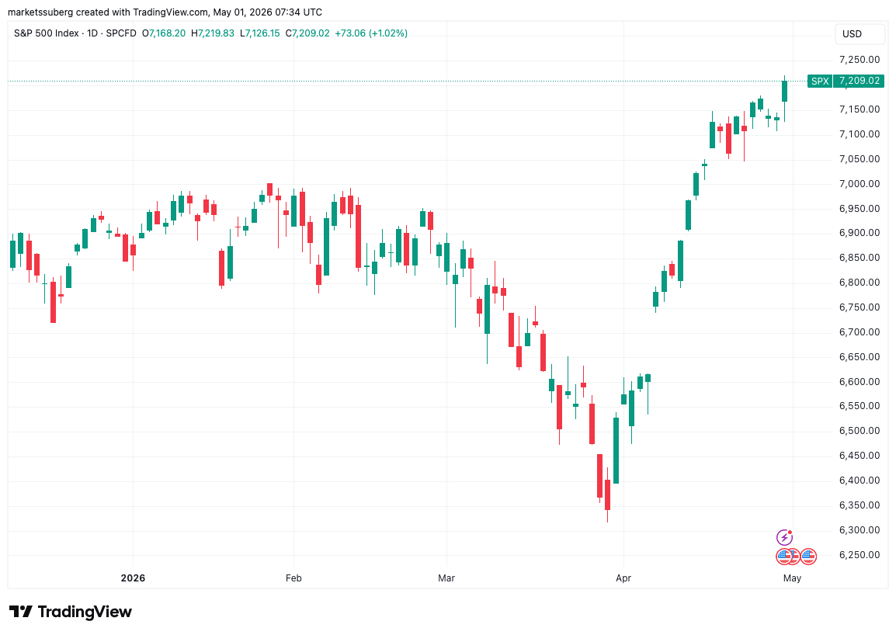
S&P 500 one-day chart. Source: Cointelegraph/TradingView
While Bitcoin’s gains were less pronounced, markets en masse appeared uninterested in US inflation warnings.
The March print of the Personal Consumption Expenditures (PCE) came in at 3.5%, per data from the US Bureau of Economic Analysis (BEA), marking its highest since August 2023.
Known as the Federal Reserve’s “preferred” inflation gauge, PCE had previously conformed to market estimates.
“In the first month of the Iran War, US inflation hit a 3-year high,” Kobeissi commented.
“April’s data will be interesting.”
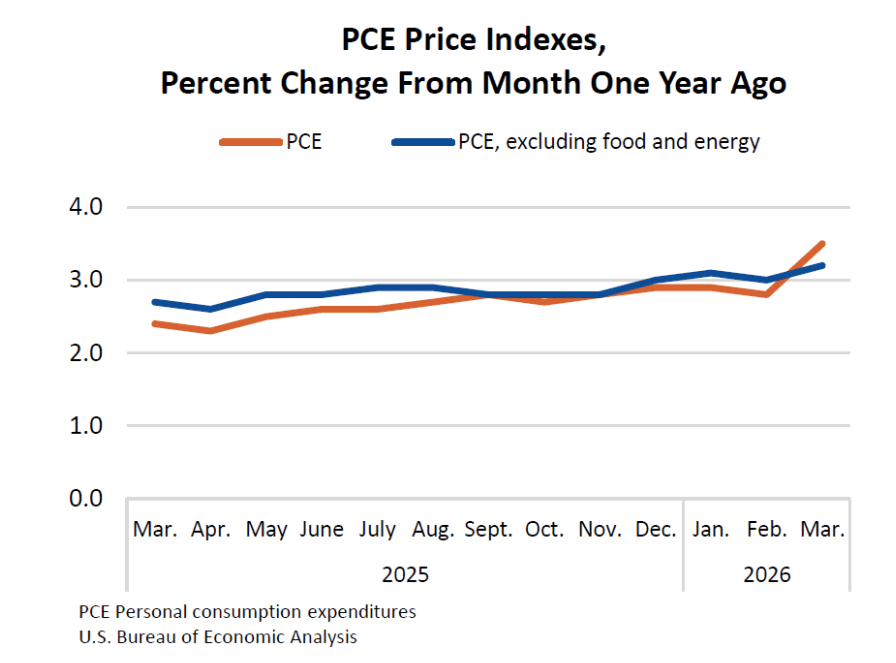
US PCE Indexes. Source: BEA
BTC price still struggling with support reclaim
Bitcoin thus closed out April’s monthly candle with mixed messages.
Related: Bitcoin Coinbase Premium threatens bear flag repeat with BTC price at $76K
At 11.9%, BTC/USD saw its highest monthly gains in a year, CoinGlass data confirmed, but the monthly candle fell short of reclaiming key support lines.
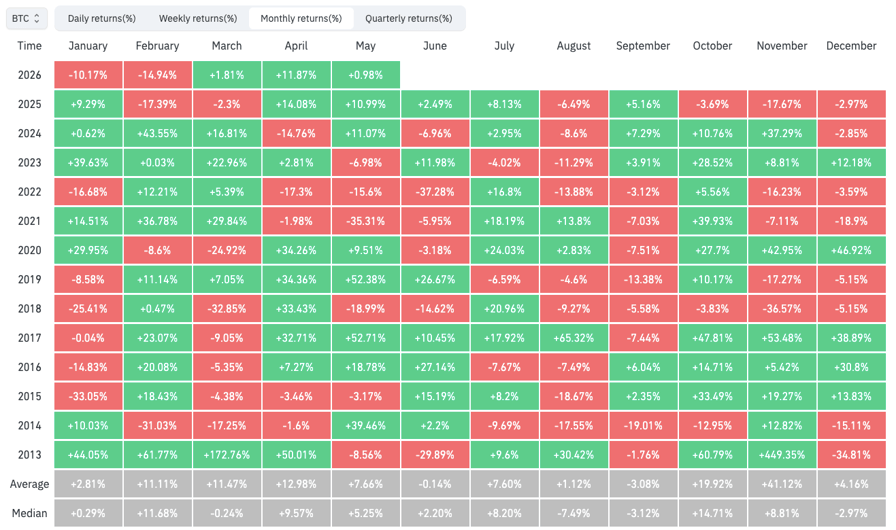
BTC/USD monthly returns (screenshot). Source: CoinGlass
As Cointelegraph reported, these included the 21-week exponential moving average (EMA), with only a single weekly close above it since last October.
“The Bitcoin pullback continues and this is looking more and more like an EMA rejection, especially if BTC isn’t able to Weekly Close above the EMA by end of week,” trader and analyst Rekt Capital warned X followers on Wednesday.
He added that a retest of the mid-$60,000 zone on weekly time frames was “technically necessary to achieve full breakout confirmation.”
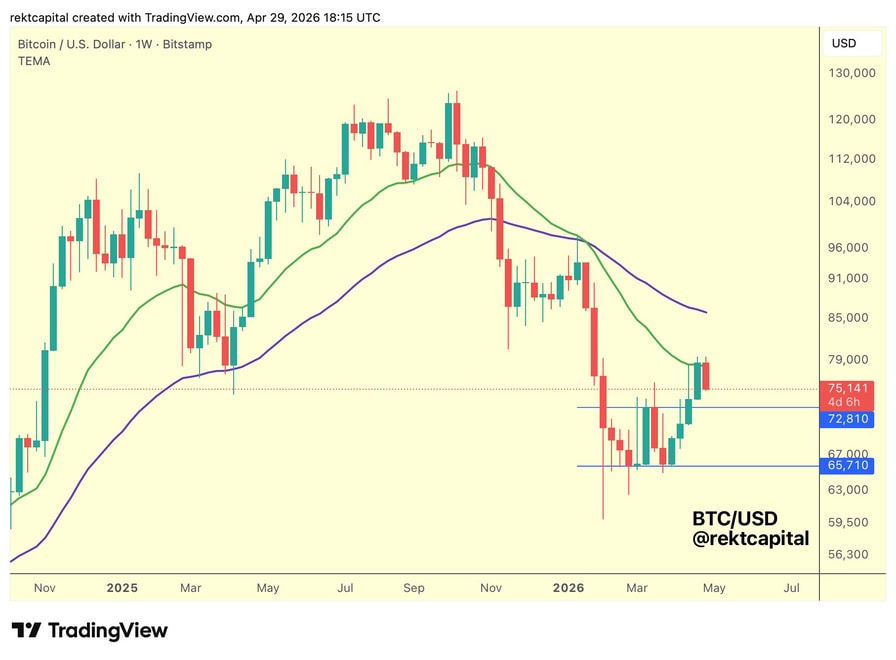
BTC/USD one-week chart. Source: Rekt Capital/X
Markets#Bitcoin #seals #monthly #gain #year #SampP #hits #fresh #alltime #high1777628984
