
XRP price has flashed multiple breakout signals at once, but a wall of 1.5 billion tokens at break-even stands in the way of the 17% rally target. A cup and handle pattern just broke out and a standard bullish divergence triggered the reversal.
Meanwhile, a potential bullish crossover could be forming. While the technical setup looks constructive, the on-chain data has other ideas.
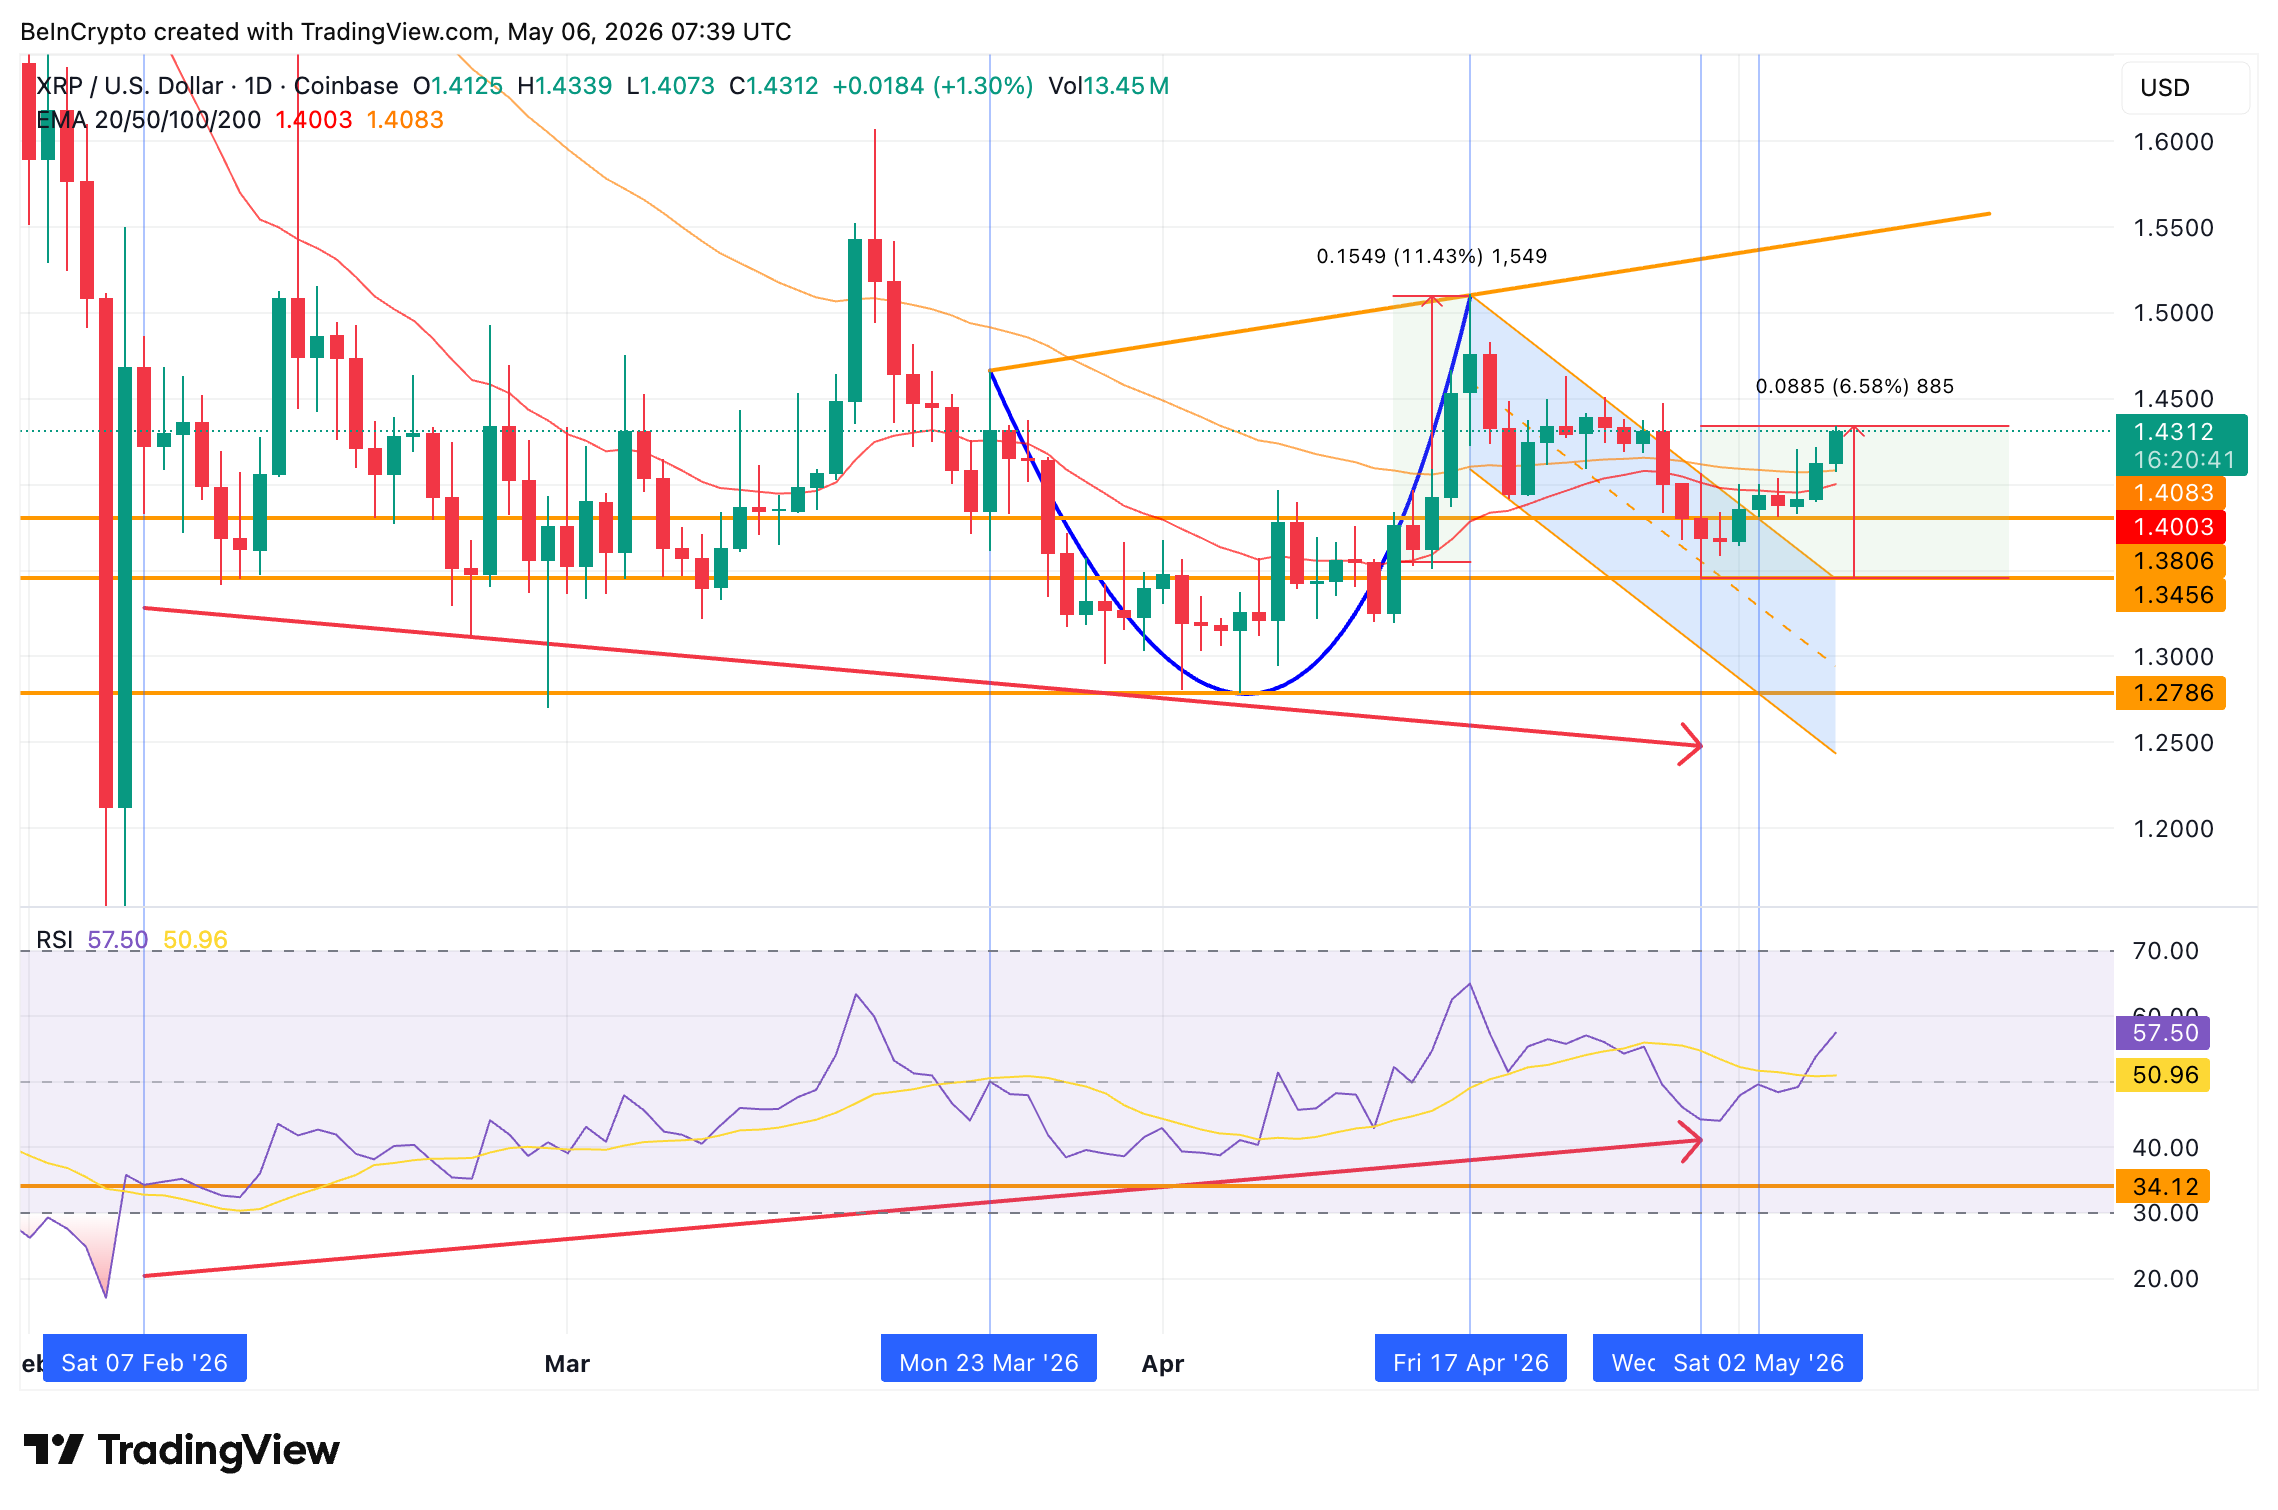
Cup and Handle Breakout Was Confirmed With Bullish Divergence
XRP has traded inside a cup and handle pattern across March and into early May. The cup formed between March 23 and April 17, while the handle consolidated between April 17 and May 2. Subsequently, the handle’s breakout above the descending channel completed on May 2.
The initial breakout had a clear catalyst.
Specifically, the Relative Strength Index (RSI), a momentum indicator, captured a constructive setup on the daily chart. Between February 7 and April 29, XRP price formed a lower low while the RSI formed a higher low. This pattern is standard bullish divergence, which typically signals a trend reversal at the end of a downtrend. The divergence flashed on April 29, and the cup and handle breakout followed three trading sessions later on May 2. As of April 29, XRP price is already up over 6%.
Beyond the divergence, the technical setup has another supporting layer. XRP price now trades above both the 20-day exponential moving average (EMA), a trend-tracking line that weights recent prices more heavily to gauge near-term momentum, at $1.400 and the 50-day EMA at $1.408. Crucially, the two lines are closing in on each other. A 20-day bullish cross above the 50-day would confirm a near-term momentum shift.

For context, the last time XRP price crossed above the 20-day EMA, on April 13, the move triggered an 11.43% rally that pushed price above the 50-day as well. The current setup is similar in structure, with the breakout already confirmed and the EMA crossover approaching.
The technical case for the breakout is built. However, the on-chain data tells a different story.
But 1.5 Billion XRP at Break-Even Stands in the Way
The breakout’s biggest test sits in two complementary on-chain signals.
Want more token insights like this? Sign up for Editor Harsh Notariya’s Daily Crypto Newsletter here.
First, the exchange flow data has shifted. XRP’s Exchange Net Position Change has been rising since yesterday. The metric tracks net flow of XRP into and out of exchange wallets, with positive readings indicating tokens moving toward exchanges where they typically get sold. Specifically, the reading climbed from approximately 37 million XRP on May 4 to roughly 46 million XRP on May 5. As a result, the acceleration suggests selling pressure has emerged into the strength.

Second, the Cost Basis Distribution Heatmap explains where that selling is concentrated. Glassnode’s data shows a cluster of 1.57 billion XRP accumulated at $1.41 to $1.42. With XRP price currently at $1.43, that cluster sits just below the spot price. Importantly, holders who accumulated at the cluster are sitting at almost break-even, and break-even cohorts are historically the largest source of overhead supply on the way up.

Beyond the lower cluster, the next significant cost basis cluster sits at $1.47 to $1.48, where 414 million XRP accumulated. If XRP price clears the lower cluster without aggressive selling, the next test arrives at the upper cluster. Therefore, both clusters need to be absorbed for the breakout to extend cleanly.

The setup is binary. If holders at $1.41 to $1.42 take break-even and exit, the handle breakout fades. Conversely, if they hold, the path opens toward the next major resistance.
XRP Price Levels That Decide the Standoff
XRP (XRP) trades at $1.430 with the immediate resistance band sitting at $1.435, the 0.382 Fibonacci level. That zone is the first hurdle the breakout needs to clear.
To begin with, a daily close above $1.435 confirms the breakout has the strength to push through the lower cost basis cluster and opens the path to $1.462 (0.5 Fibonacci) and $1.490 (0.618 Fibonacci). Subsequently, a clean break above $1.490 would clear the second cost basis cluster at $1.47 to $1.48 and open the path to $1.529 (0.786 Fibonacci) and the floating neckline at $1.551.

Above the neckline, a daily close above $1.551 activates the cup and handle’s measured-move target. The pattern projects approximately 17% upside toward $1.811. The path between $1.551 and $1.811 runs through the 1.0 Fibonacci at $1.579 and the 1.618 Fibonacci extension at $1.723.
In contrast, the downside levels are stacked tightly. Holding $1.401, the 0.236 Fibonacci level, keeps the cup and handle structure intact. However, a break of $1.401 sends XRP toward $1.345 as the next major support. Below $1.345, the path opens to $1.277 as the long-term floor. A break below $1.277 would invalidate the cup and handle pattern entirely.
Ultimately, the level math is binary. A confirmed close above $1.551 opens the path toward $1.81. A close below $1.278 invalidates the breakout setup.
The post XRP Flashes a 17% Breakout Hope But 1.5 Billion Tokens Stand in the Way appeared first on BeInCrypto.
Trading,Altcoin Analysis,Editor’s Pick,Ripple (XRP) Analysis,Ripple (XRP) News#XRP #Flashes #Breakout #Hope #Billion #Tokens #Stand1778086622
