
Bitcoin (BTC) dropped to $76,000 during the early Asian trading hours on Monday as US-Iran tensions resurfaced.
Key takeaways
- Bitcoin falls to $76,500 as bearish momentum becomes increasingly tied to geopolitical developments.
- Over $607 million in long positions have been liquidated in the last 24 hours.
- Bitcoin traders say support at $76,000 should hold to avoid a BTC price drop to $65,000.
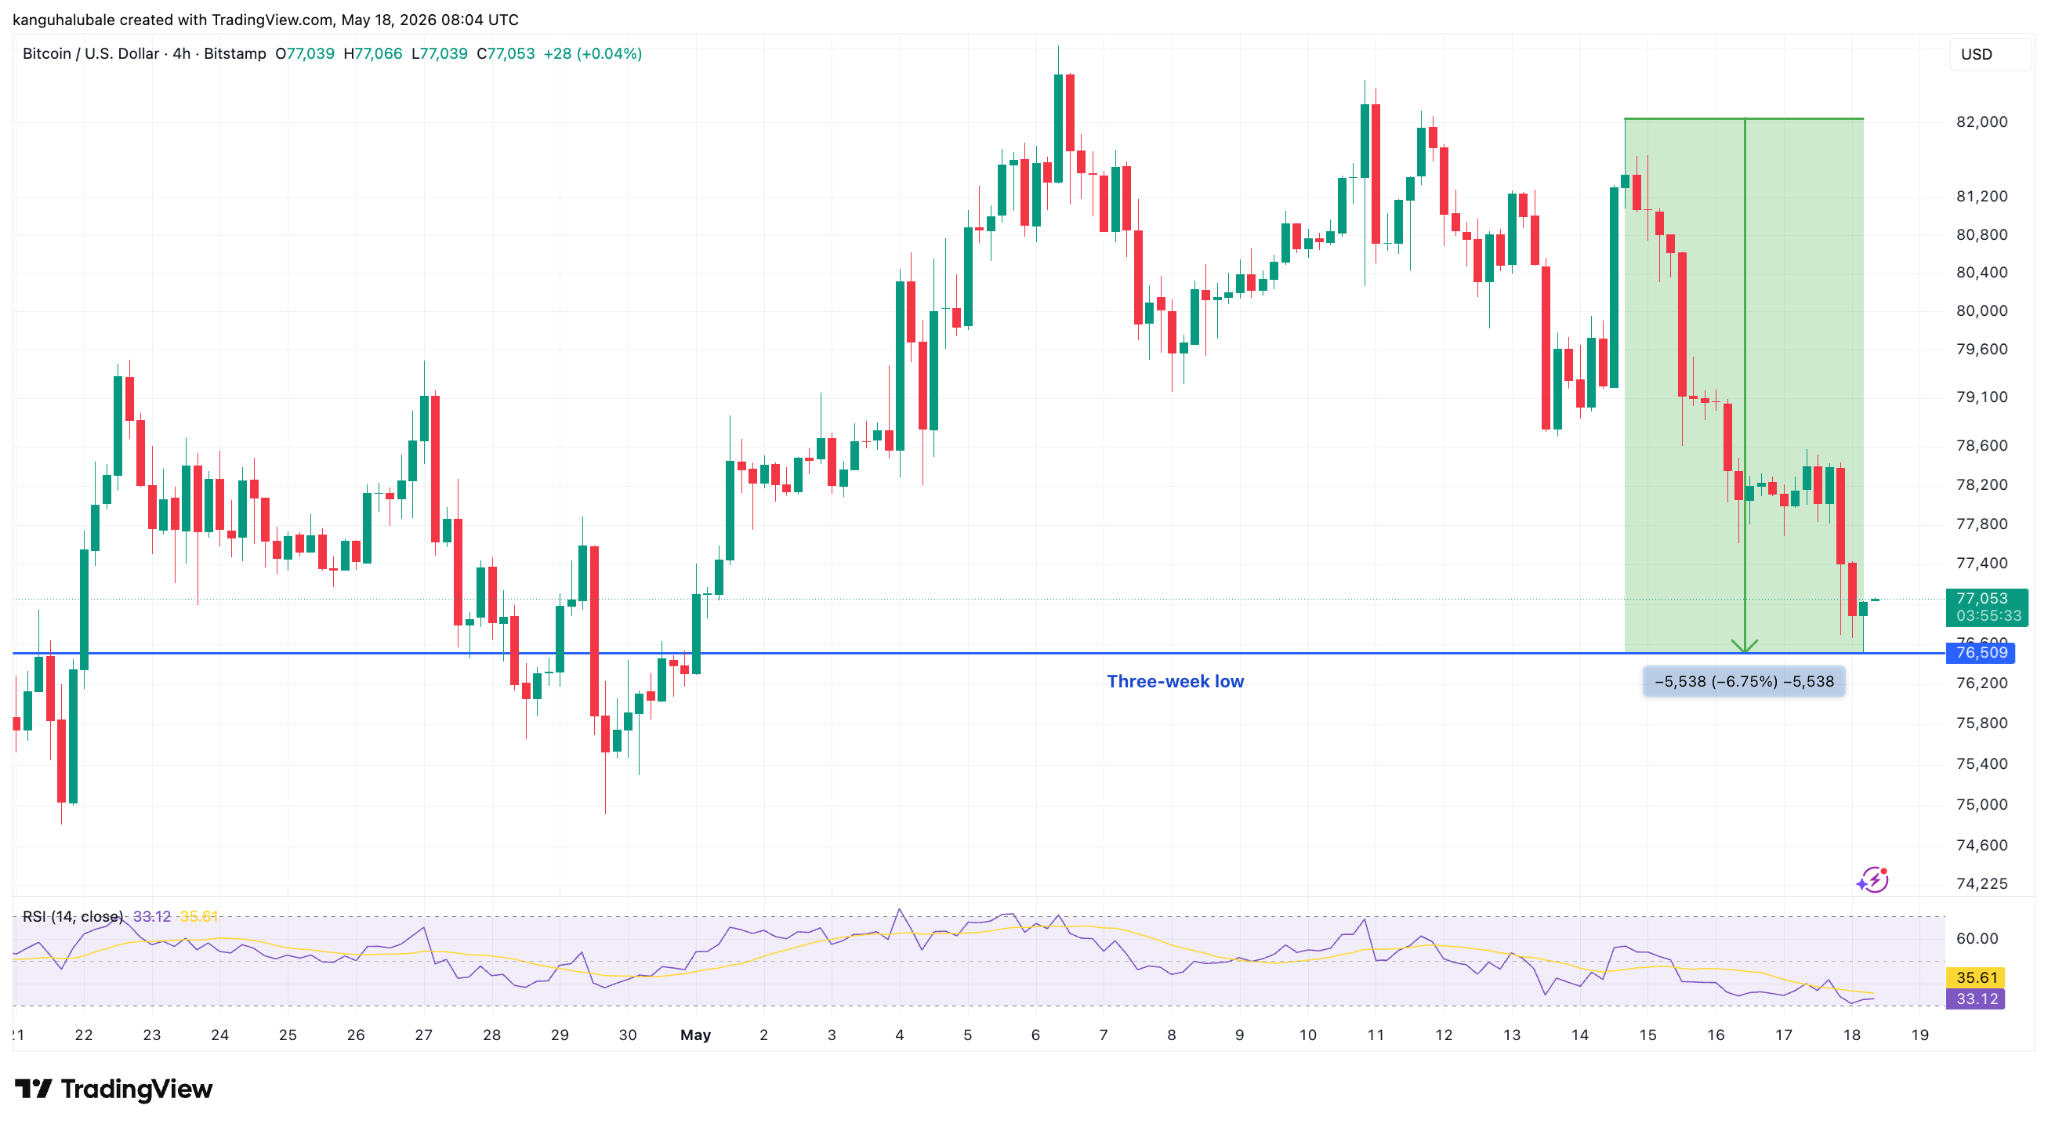
Bitcoin hits three-week lows with 7% drop
Data from TradingView showed BTC price dropped as much as 7% over the last three days to three-week lows of $76,500, erasing all the gains made since May 1.
BTC/USD one-hour chart. Source: Cointelegraph/TradingView
The losses come just days after BTC/USD reached 13-week highs around $83,000, boosted by strong inflows into spot exchange-traded funds and optimism surrounding the US CLARITY Act.
Related: BTC price ‘bull trap’ at $76.5K? Five things to know in Bitcoin this week
On Sunday, however, US President Donald Trump issued fresh threats against Iran regarding delays in the peace agreement, warning that the “clock is ticking.”
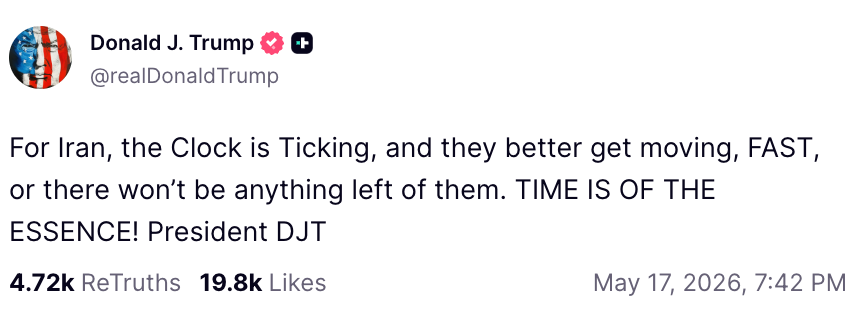
Source: TruthSocial/Donald J. Trump
“Trump confirms the clock is ticking for Iran. The US is allegedly preparing for a potential new military operation against Iran,” analyst CryptoRover said in a Monday post on X, adding:
“This is extremely dangerous for $BTC.”
The move in Bitcoin was accompanied by $607 million in long liquidations over the last 24 hours, with BTC long liquidations accounting for $190 million.
This brought the total liquidations across the crypto market over the last 24 hours to $677 million.
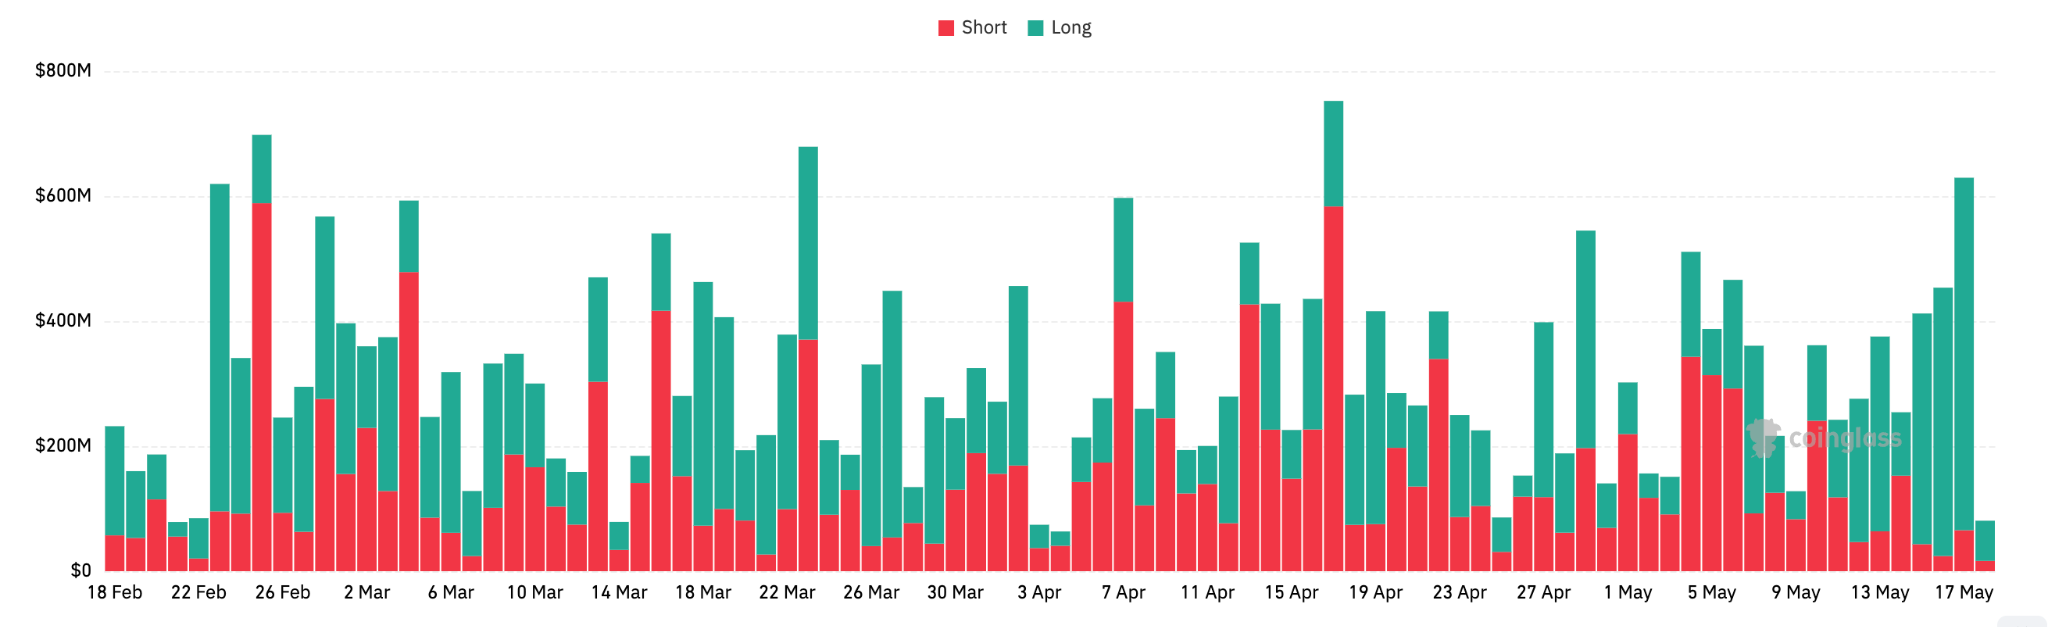
Total crypto liquidation across all exchanges. Source: CoinGlass
Oil also saw volatility, with WTI rising over 3% in a matter of hours to $104 per barrel before correcting to $101.
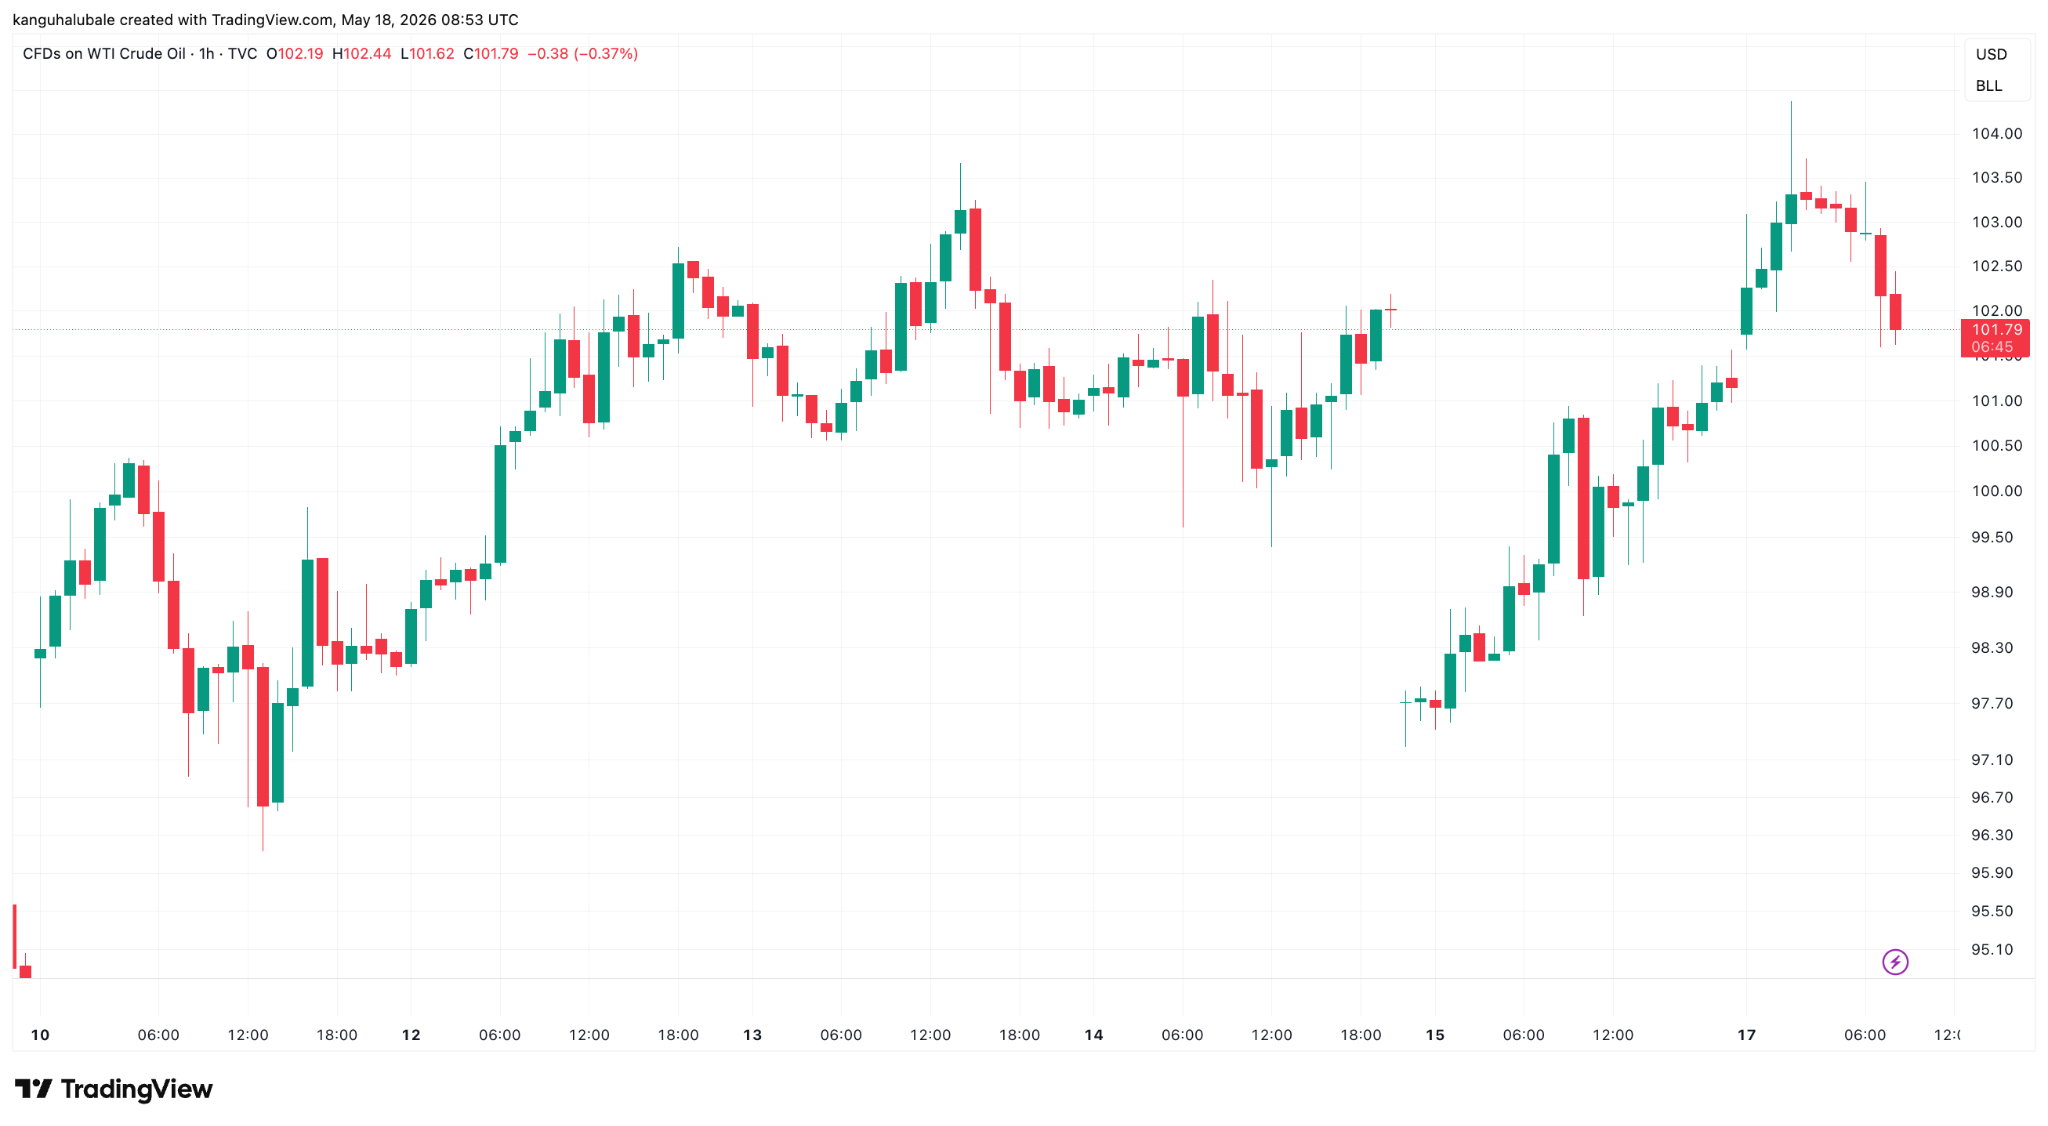
CFDs on WTI crude oil one-hour chart. Source: Cointelegraph/TradingView
“WTI surged above $103 as Trump publicly lost patience with stalled peace talks and a waiver for Russian crude sales expired, adding to supply fears around the still-disrupted Strait of Hormuz,” trading resource Capital.com said in a Monday X post, adding:
“Higher oil means hotter future inflation, reinforcing higher-for-longer Fed expectations and lifting both the dollar and yields — a tough combination.”
Bitcoin traders say bears “back in the driver’s seat”
Bitcoin traders, meanwhile, looked at the technical setup for clues as to where the price might head next.
Analyst CryptoJelleNL said that a bearish divergence from the relative index as BTC/USD ran into resistance at $82,000 was responsible for the “pullback we’re in right now,” adding:
“Bears getting back in the driver’s seat?”
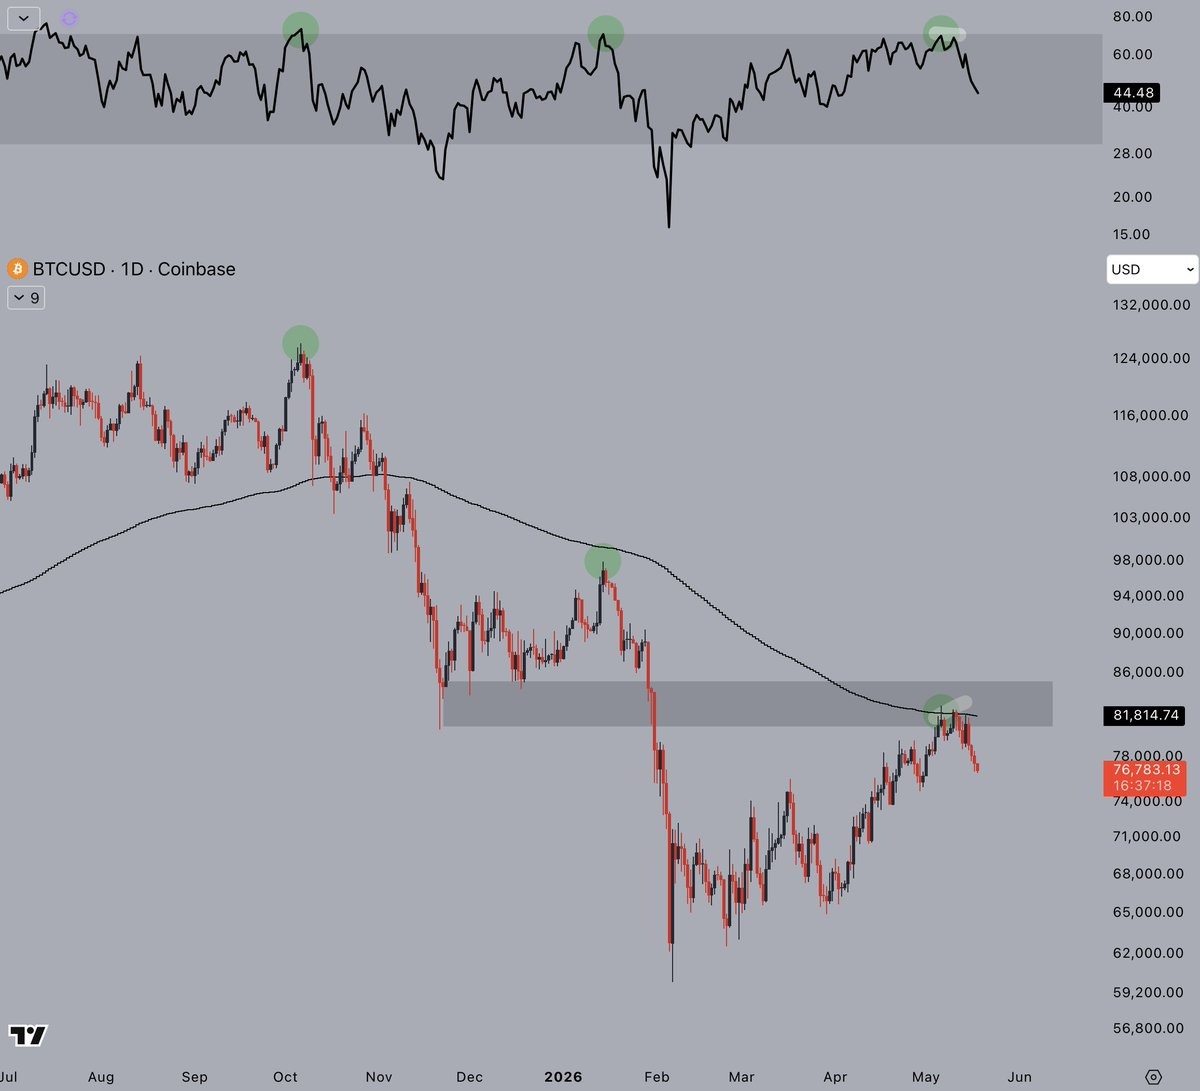
BTC/USD daily chart. Source: X/CryptoJelleNL
MN Capital founder Michael van de Poppe said immediate support at $76,000 should hold to “prevent a market-wide crash.”
An accompanying chart showed other support levels to watch if this area is lost, including the $71,000-$73,000 demand zone and the local low at $65,000.
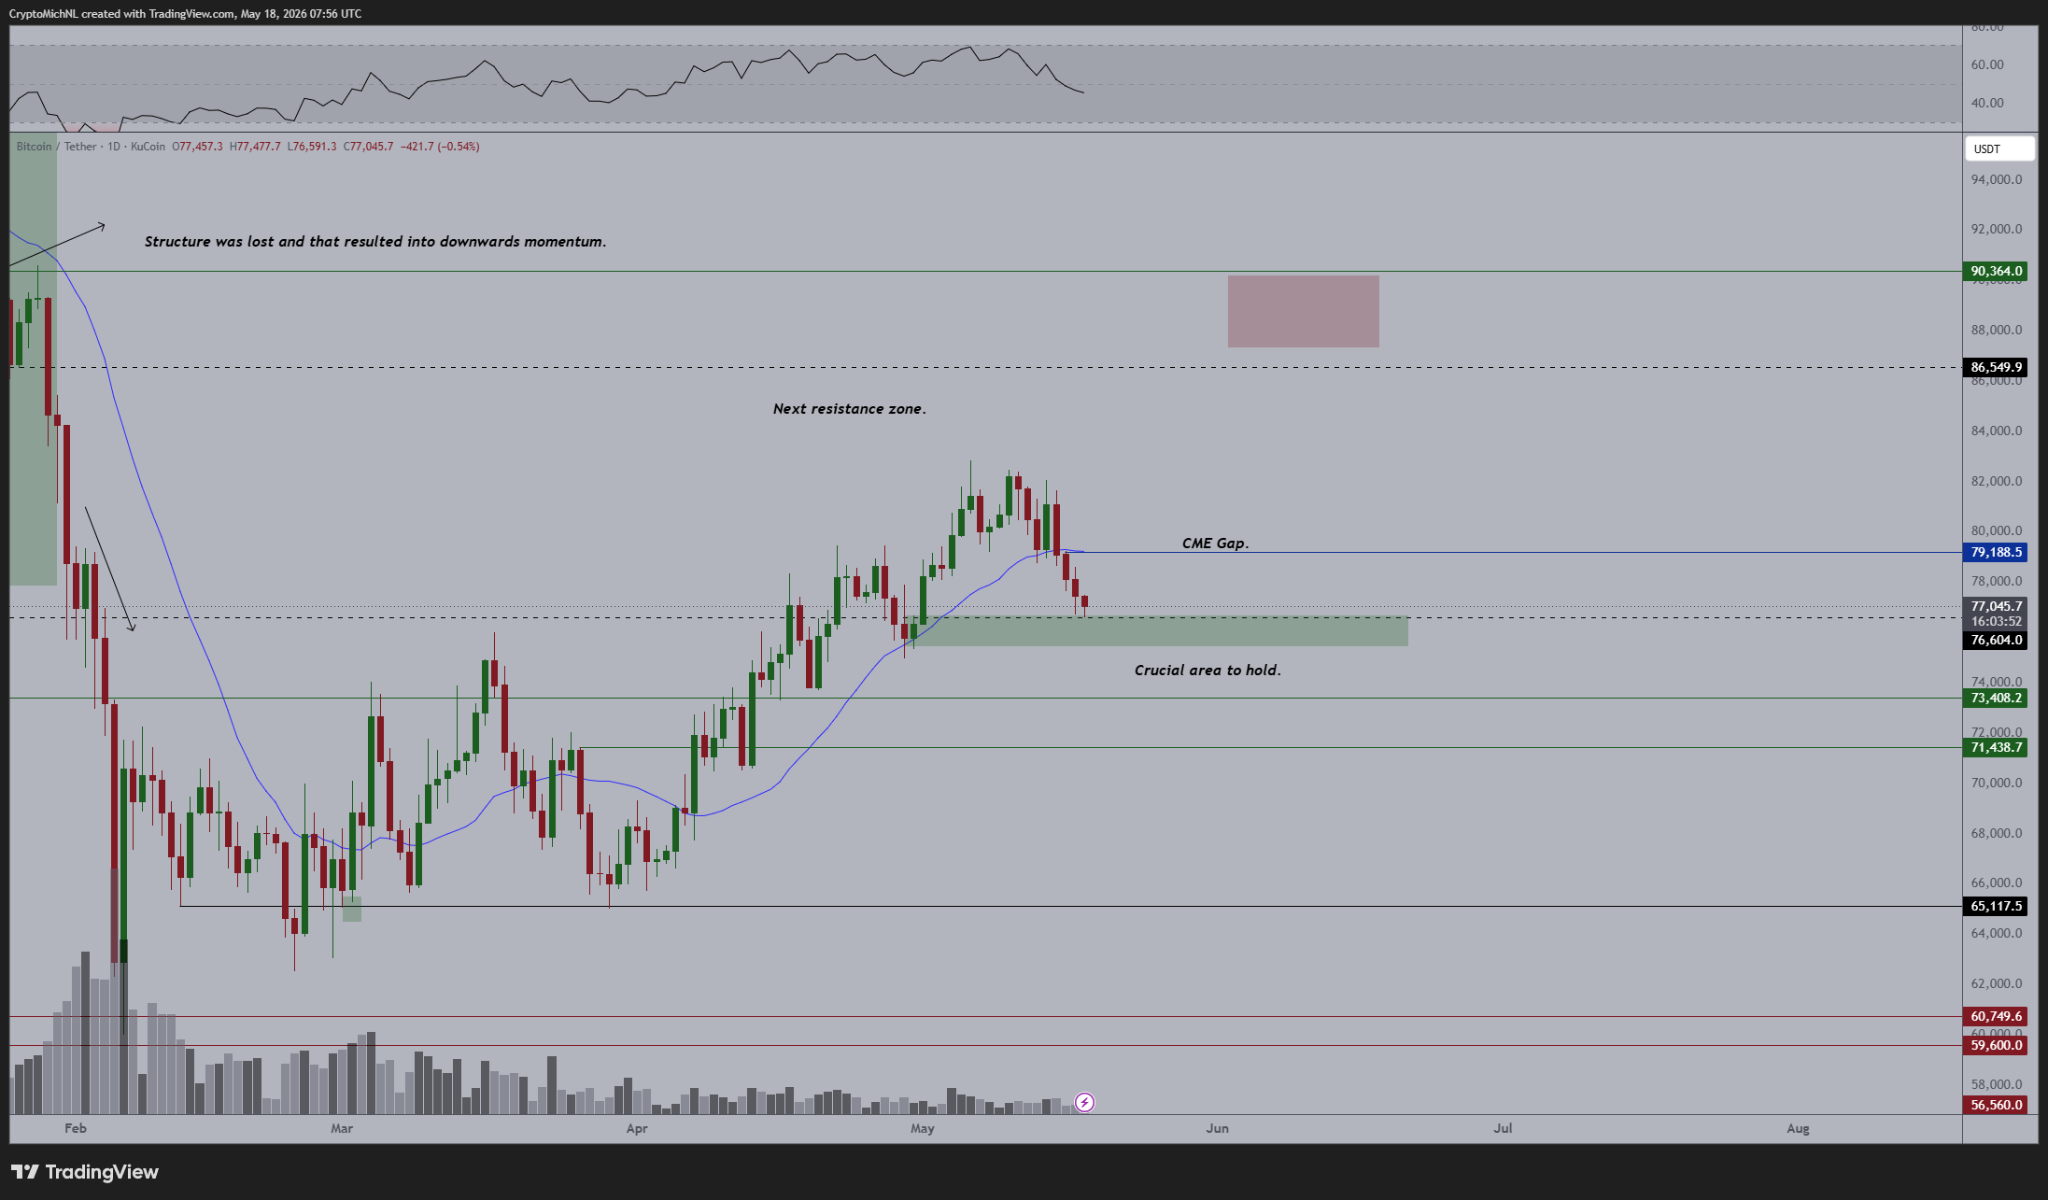
BTC/USD chart. Source: X/Michael van de Poppe
The local low at $65,000 coincides with the target of an inverted V-shaped pattern, as shown on the daily chart below. This represents a 16% drop from the current price.
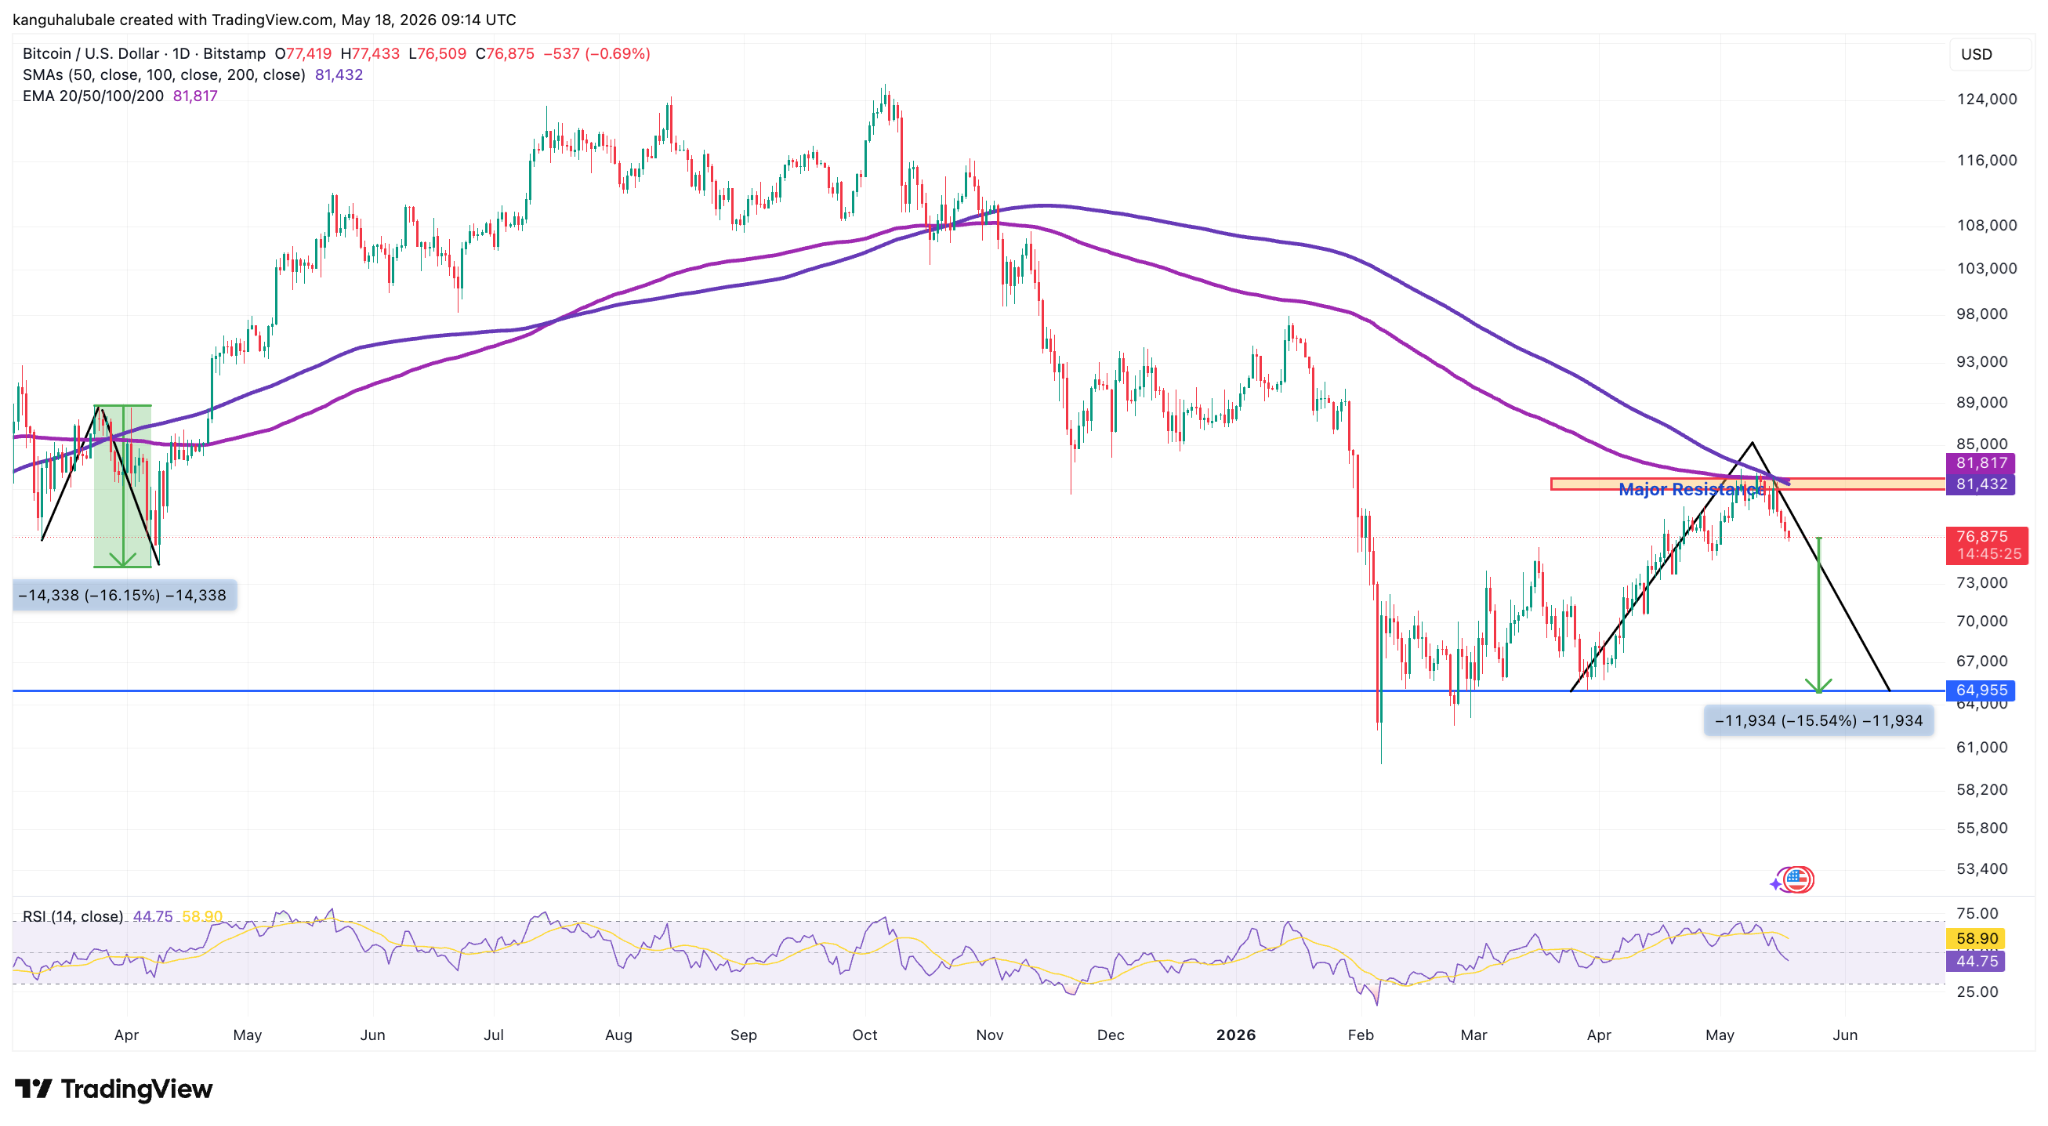
BTC/USD daily chart. Source: Cointelegraph/TradingView
Note that the BTC/USD pair experienced a similar sharp correction of the same magnitude after being rejected by the 200-day moving averages in April 2025.
Markets#Bitcoin #falls #76K #Trump #clock #ticking #Iran1779108759
