
Bitcoin (BTC) price dropped to $76,500 on Monday, erasing nearly all of this month’s gains as fresh US-Iran war tensions soured the crypto market sentiment. This has led investors and traders to reevaluate their risks and stay cautious, with many recent buyers selling their BTC at a loss.
Key takeaways:
- Bitcoin short-term holders sold over 10,000 BTC worth approximately $770 million at a loss on Monday.
- Analysts agree that pushing Bitcoin’s price below $76,000 could trigger a fresh downtrend toward $65,000-$70,000.
Bitcoin’s “weak hands” realizing losses
Bitcoin has retraced 7% from its local high of $82,800 set on May 6. The rejection from the 200-day moving averages at $82,000, the daily close below the true market mean, and the short-term holder cost basis around $78,000 have cemented a more risk-off stance among Bitcoin investors.
Related: Bitcoin’s trend-defining battle starts at $74K support: Analyst
Onchain data from CryptoQuant showed that more than 10,000 BTC were transferred by short-term holders — investors who have held the asset for less than 155 days — to Binance at a loss on Monday.
These moves occurred with Bitcoin at roughly $76,900, about 2% below their average purchase price of $78,440, suggesting that recent buyers sent approximately $769 million in BTC to Binance at a loss.
This “reflects short-term holder stress, forced selling, or capitulation from weaker hands during a correction,” CryptoQuant analyst Amr Tah said in a QuickTake post on Tuesday.
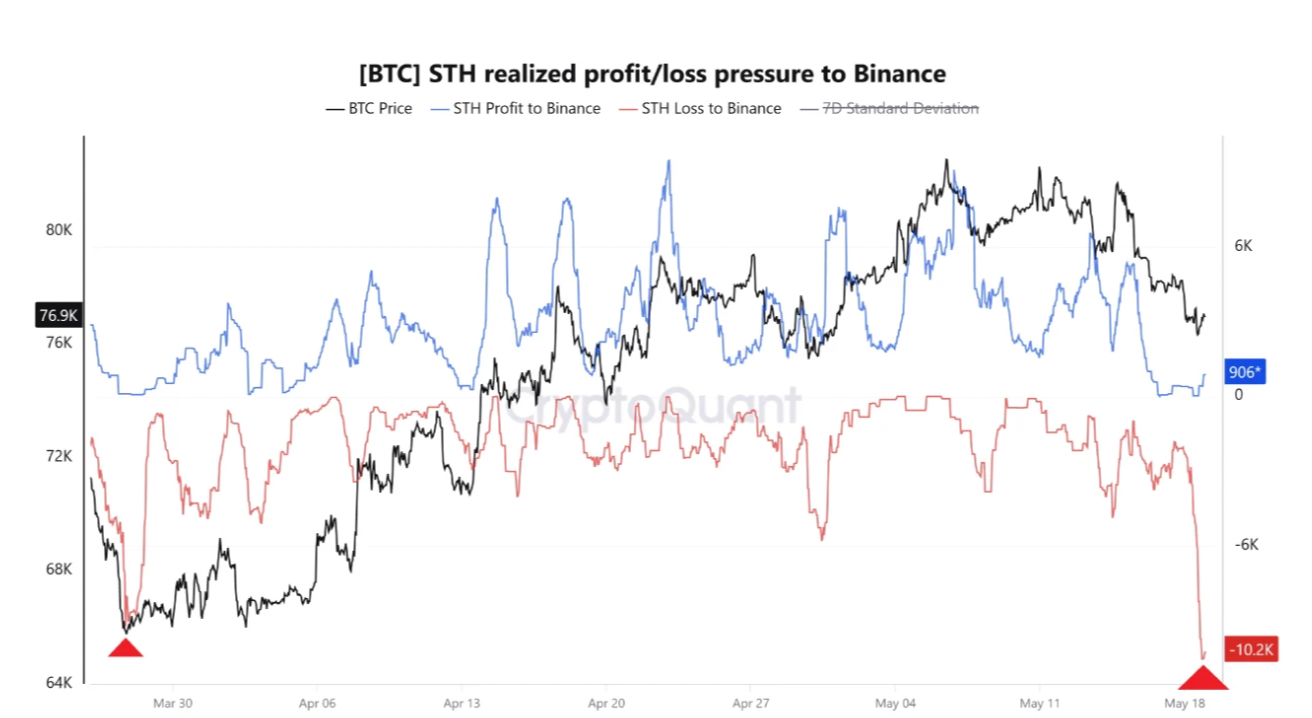
Bitcoin: Transfer volume by STH in loss to Binance. Source: CryptoQuant
This activity underscores a familiar pattern of short-term speculators panic-selling during market dips, frequently realizing losses.
A similar occurrence in mid-November 2025 preceded a 15% BTC price decline to $78,400 from $96,000 in less than five days.
Additional data from Glassnode shows that more than “7.8M BTC are currently held at a loss,” a supply overhang that the market would need to “absorb before any sustained move higher becomes structurally credible.”
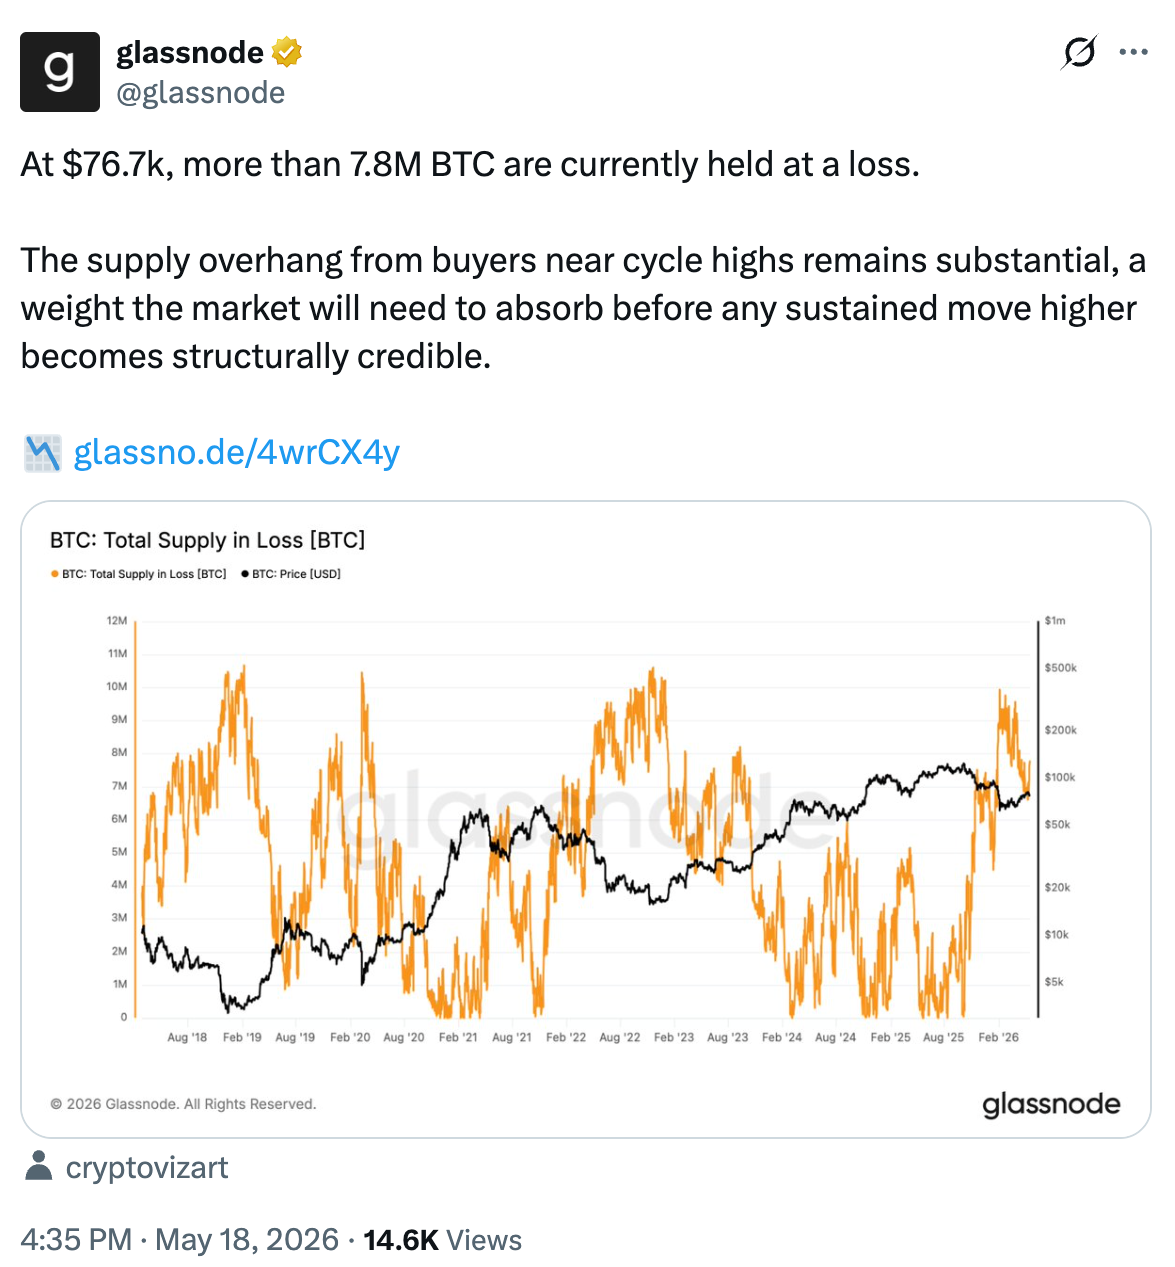
BTC total supply in loss. Source: Glassnode
Also accompanying Bitcoin’s slump are heavy outflows from US-based spot Bitcoin exchange-traded funds (ETFs), which have recorded negative flows for six out of the last eight days.
These investment products saw $648.6 million in net outflows on Monday, the largest withdrawal since Jan. 29.
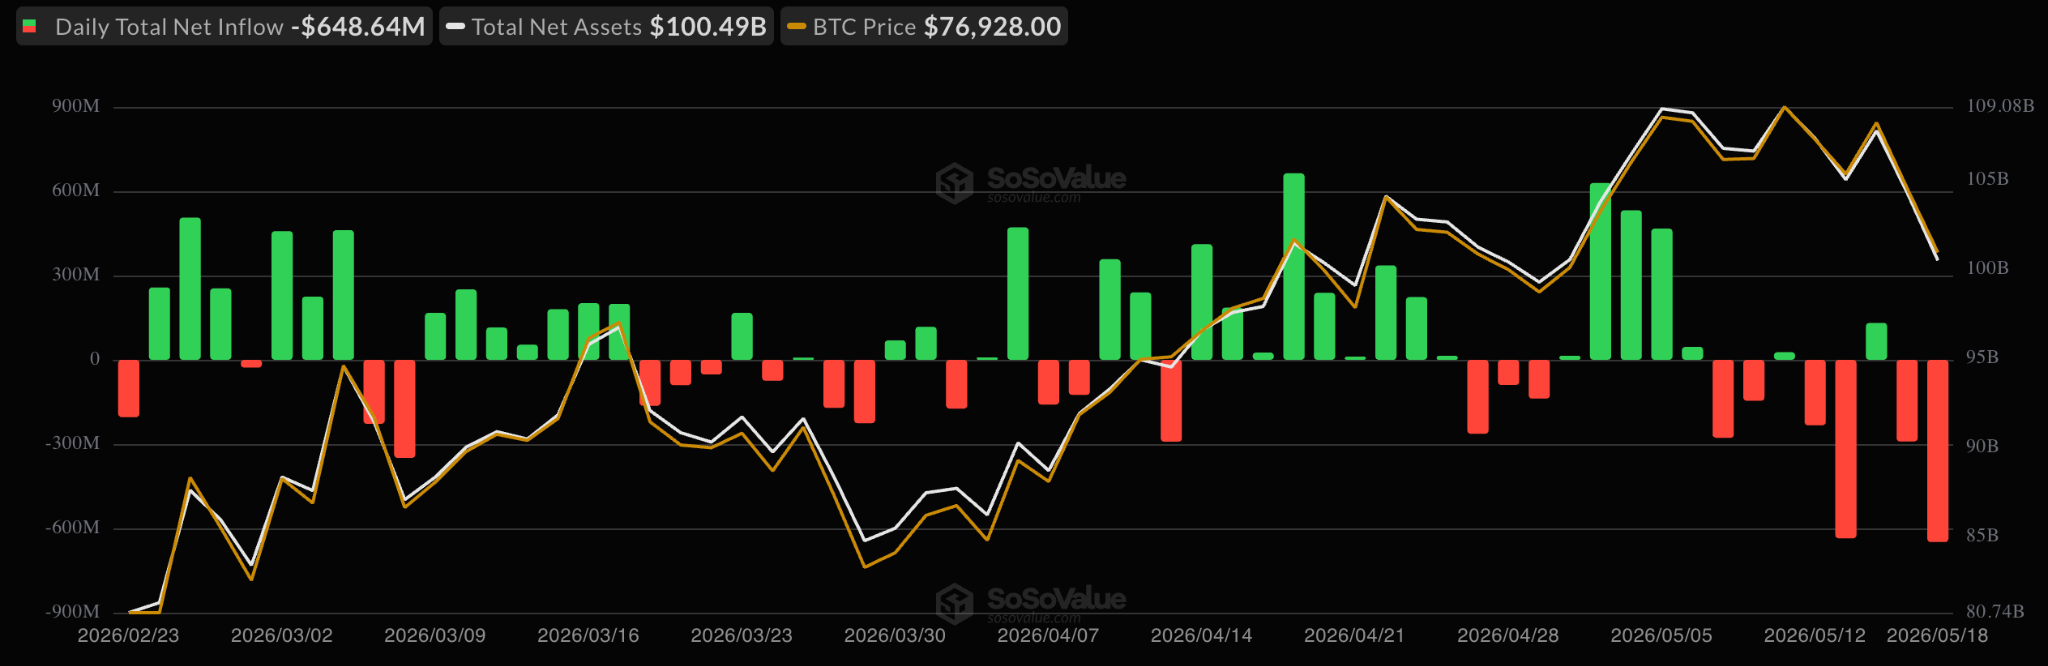
Spot Bitcoin ETF flows table. Source: Farside Investors
Global Bitcoin investment products also recorded $981.5 million in net outflows during the week ending May 15, suggesting declining institutional appetite for BTC.
“Markets are getting absolutely hammered,” analyst Alek_Carter said in an X post on Tuesday, referring to the large outflows from Bitcoin investment products, adding:
“Money is rotating out fast, panic is creeping in, and traders are clearly hitting the risk-off button hard.”
As Cointelegraph reported, record-low retail investor activity, aggressive selling in the futures markets and weakening spot demand are pulling down Bitcoin’s price to new May lows.
How low can Bitcoin price go?
The Bitcoin HODL Waves indicator, which tracks the age distribution of BTC holdings, suggests Bitcoin could bottom at $65,500-$70,500 if current market weakness continues.
Historically, spikes in long-term holder activity and declining short-term speculation have coincided with major market bottoms before recoveries.
The chart below shows a stronger long-term holder base (the blue/purple bands are noticeably thicker), “reflecting growing institutional adoption,” CryptoQuant analyst Sunny Mom said in a Quicktake analysis on Tuesday.
This suggests that the supply structure is structurally stronger in the current cycle than before, “which changes how BTC forms its bottom,” the analyst said, adding:
“Our predicted price range for this cycle’s bottom is $65.9K–$70.5K. If $70.5K holds, we’ll slowly grind out a bottom in the upper range.”
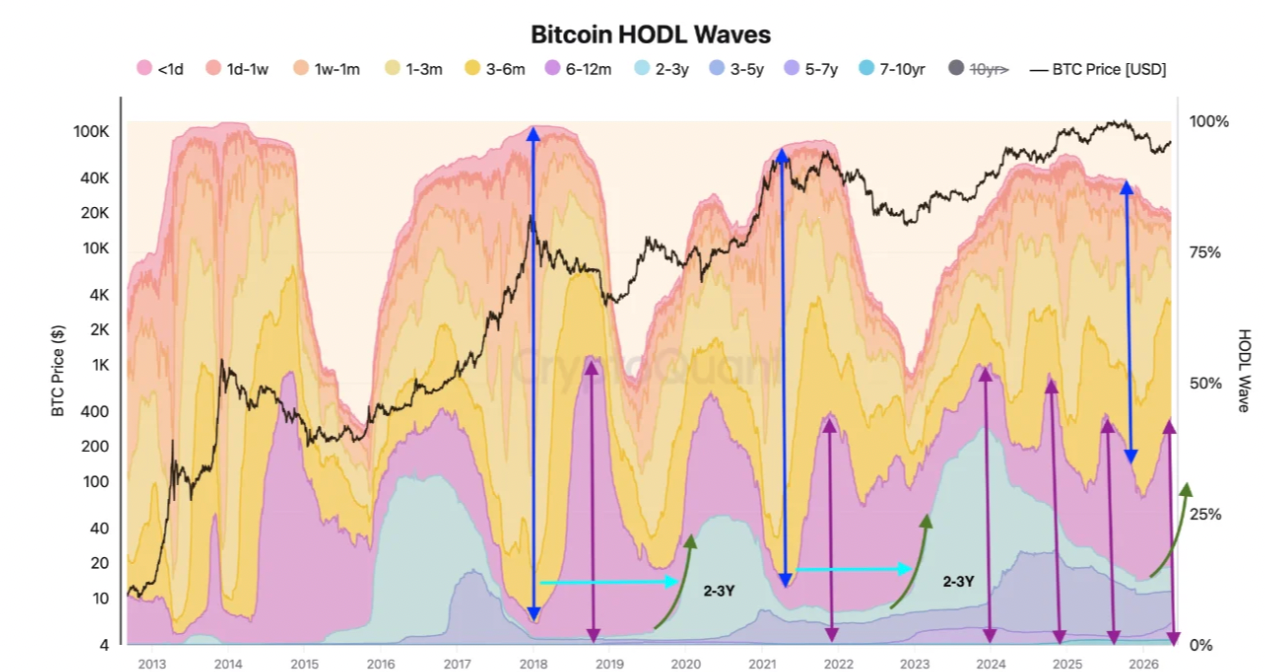
Bitcoin HODL wave indicator. Source: CryptoQuant
From a technical perspective, Bitcoin is printing the fifth consecutive daily red candle, suggesting that the “momentum is starting to shift back to the bears,” analyst Alex Marzell said on Monday in a post on X, adding:
“Bitcoin may come back to retest the breakout zone around $70K support.”
Echoing this sentiment, MN Capital founder Michael van de Poppe said this “doesn’t look great” for Bitcoin, adding that the price needs to hold support at $74,500-$76,000 “in order to get back some momentum in the markets.”
“If this area doesn’t hold, then we’re most likely cascading through the lows of the recent rally and test <$65,000 for support.”
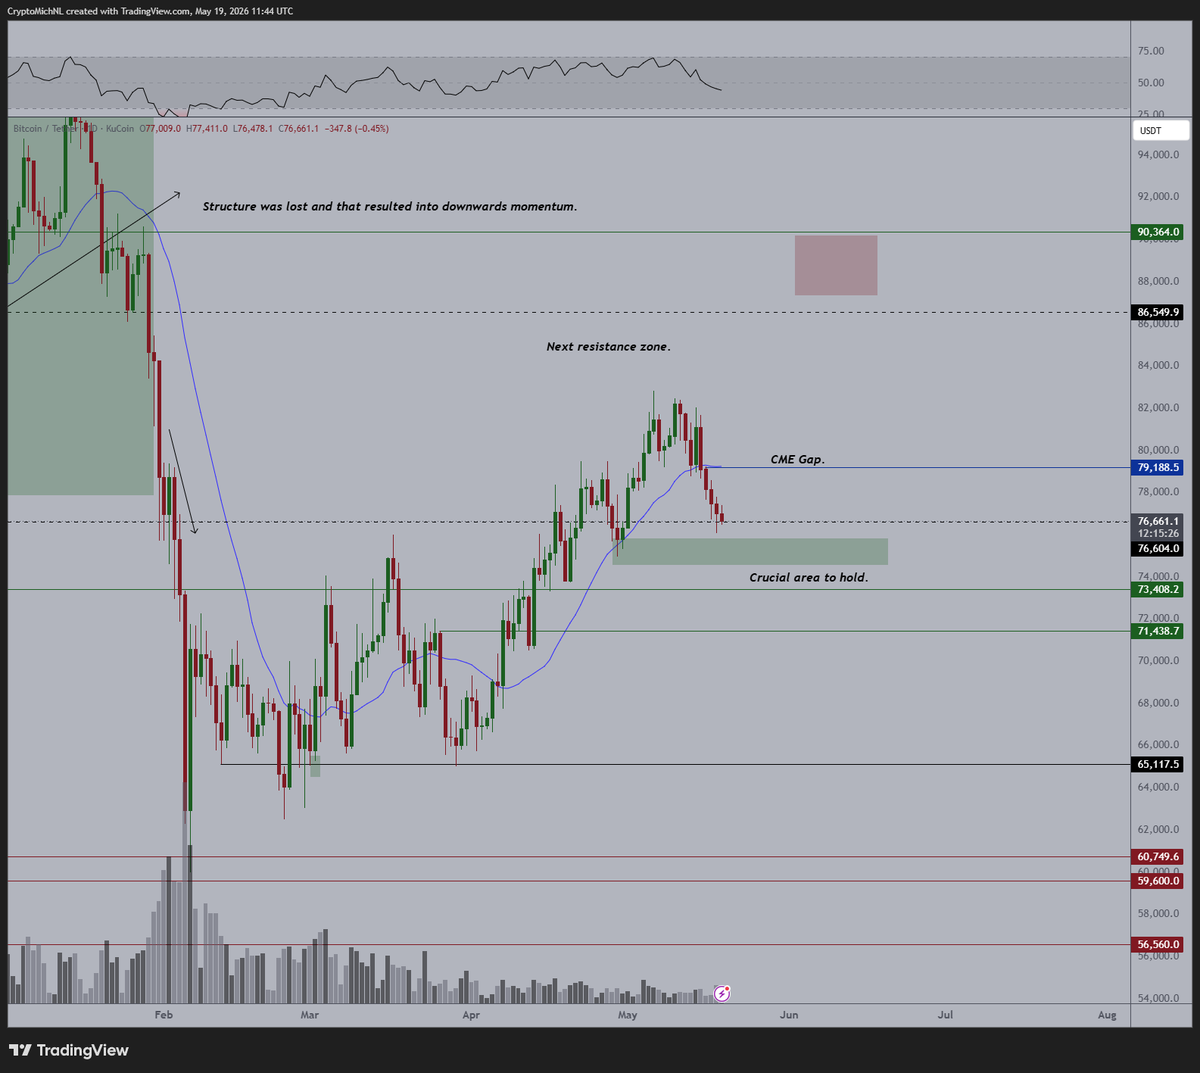
BTC/USD daily chart. Source: X/Michael van de Poppe
As Cointelegraph reported, a break below the 50-day SMA at $76,000 would increase the risk of the BTC/USDT pair dropping to $65,000. in the short term.
Markets#Bitcoin #holders #sell #770M #BTC #loss #65K #BTC #price #calls1779204231
