
Bitcoin price 31% recovery from under $63,000 to over $80,000 is not distributed evenly across the clock; roughly 65% of the alpha prediction is concentrated in a tight band of hours tied directly to Bitcoin ETF creation and redemption windows.
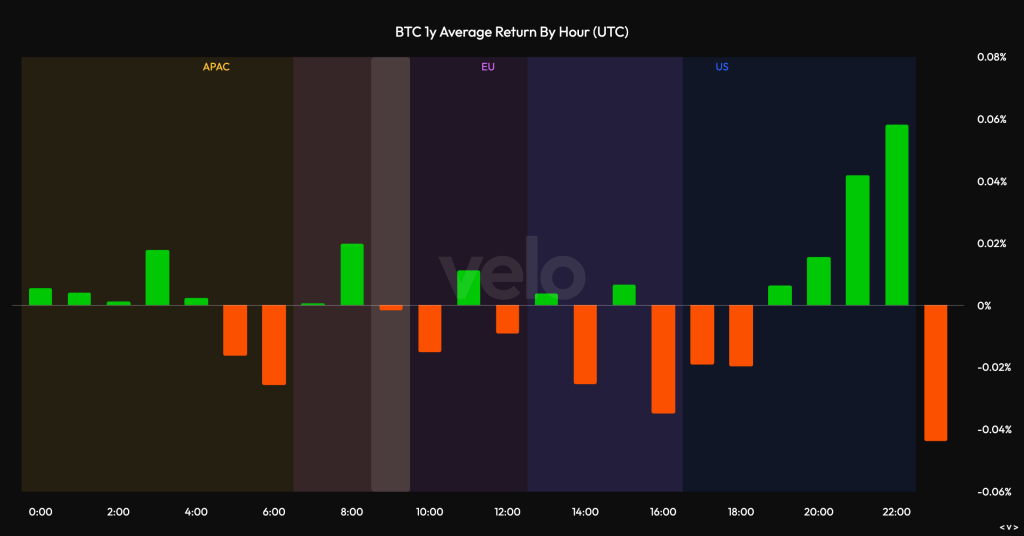
Three months of price data from Velo shows APAC hours delivering a 13% return, the U.S. session adding 11.5%, and Europe contributing just 6.5%, a gap wide enough to be structural, not coincidental.
The implication is uncomfortable for anyone trading outside those windows: the market’s intraday rhythm has been reset by institutional clocks, not retail impulse.

Bitcoin price is currently holding just above $81,500, a level the market has tested multiple times since early April, when U.S. session returns flipped decisively positive after being flat to negative through February and March.
Bitcoin ETF inflows have added over $532 million in recent reporting periods, and that capital moves on TradFi schedules – which is exactly what the hourly return data reflects.

Discover: The best crypto to diversify your portfolio with
Which Hours Are Doing the Heavy Lifting?
The single strongest hour in Velo’s three-month dataset is the 00:00–01:00 UTC candle, producing an average return of 0.10%.
That window sits at the seam of two sessions, late U.S. trading and the earliest APAC liquidity, and functions as a handoff point where fresh market liquidity enters from Tokyo and Singapore desks while New York positions are still live.
The second strongest hour is 15:00 UTC, deep in the European afternoon and directly overlapping with the U.S. pre-market, where the Europe-U.S. overlap generates roughly 31% higher volume than daily averages according to session analysis from Amberdata. The worst single hour is 06:00 UTC – mid-APAC, pre-Europe, and structurally thin.
Spot CVD, or Cumulative Volume Delta, during the U.S. session windows shows aggressive market buying rather than passive limit accumulation, confirming that institutional trading, not retail limit orders, is driving the directional moves.
The U.S. session (16:00–00:00 UTC) averaged the lowest orderbook depth at $3.32M despite high volume, meaning large orders are being executed into relatively shallow books and moving price efficiently.
Mondays have been the strongest day of the week at approximately 1.5% average return, with Wednesday second at 0.65% and Thursday the worst at negative 0.55%. Weekdays overall average positive 0.4%; weekends average negative 0.25%.
As long as Bitcoin ETF inflow windows remain active and institutional order routing concentrates volume in the 00:00 UTC and 15:00 UTC bands, overnight and weekend sessions remain structurally disadvantaged for directional trades.
Discover: The best pre-launch token sales
Bitcoin Price Prediction: BTC Pushes Above $81,000 as Recovery Structure Eyes $84,000 Breakout
BTC is sitting at $81,864 on the daily chart, and the recovery structure here is the most convincing it has looked since the February collapse from $98,000 down to $61,000.
Price has been printing higher lows since the February bottom and is now pushing into the $80,000 to $82,000 range, which is significant because this zone was the support level that broke down and triggered the final capitulation leg in early February, making it now the first major overhead supply zone to reclaim.
The fact that BTC is pushing through $80,000 with momentum rather than getting immediately rejected is a positive sign, and a daily close above $82,000 to $84,000 held for a few sessions would be the clearest signal yet that the trend has genuinely shifted.
Above that, $88,000 and then $95,000 to $98,000 are the next resistance clusters from the January distribution zone, and those are the levels that need to fall for the all-time high conversation to come back onto the table.
On the downside, $75,000 is the immediate support that needs to hold on any pullback, and $68,000 to $70,000 below that is the range where the base was built throughout March and April, which should provide strong demand if tested.
The broader Bitcoin price prediction structure is the most bullish it has been in months, with higher lows since February, momentum building into real resistance, and the market finally showing signs it wants to reclaim lost ground rather than just bounce and fade.
The post Bitcoin Price Prediction: Data Shows Bitcoin’s Entire Recovery Is Happening During ETF Trading Hours — What Does That Mean for Retail Traders? appeared first on Cryptonews.
Bitcoin News,Bitcoin (BTC)#Bitcoin #Price #Prediction #Data #Shows #Bitcoins #Entire #Recovery #Happening #ETF #Trading #Hours #Retail #Traders1778064153
