
Pudgy Penguins (PENGU) broke above its descending trendline this week, clearing a level that had held since July 2025. The token climbed more than 7% in the last 24 hours on rising spot volume.
The move coincides with a Relative Strength Index (RSI) breakout on the daily chart. That combination suggests the early weeks of a potential trend reversal after nine months of downside.
PENGU Breaks Long-Term Downtrend on Daily Chart
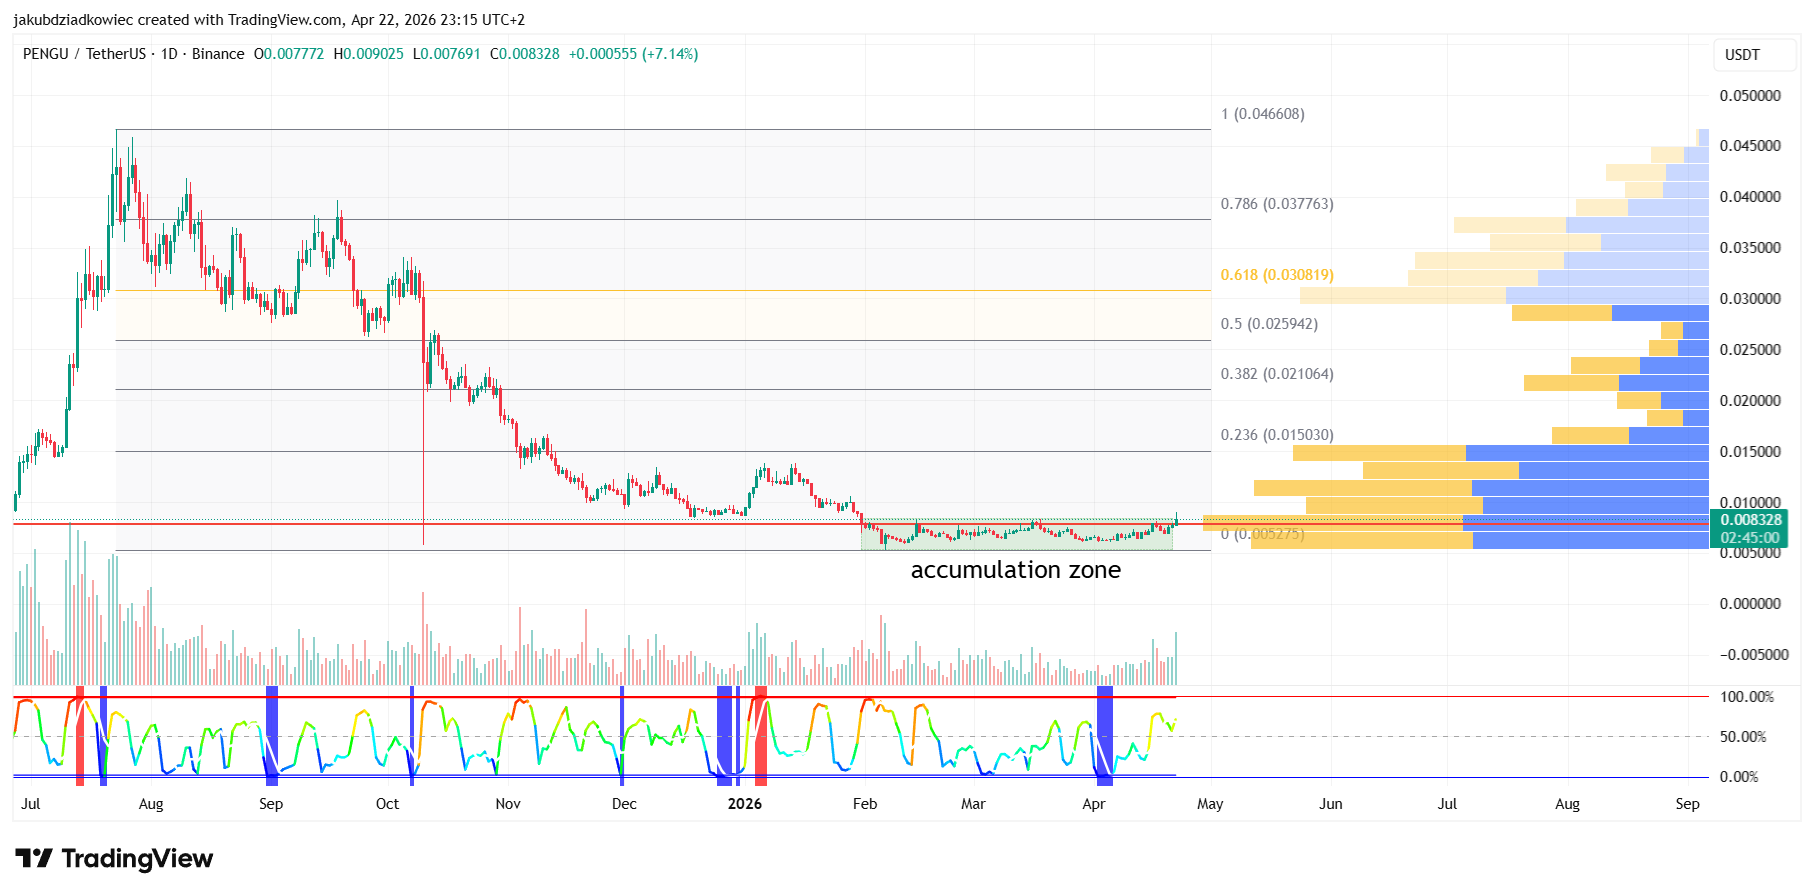
The daily PENGU chart shows the token reclaiming $0.008 after roughly three months inside an accumulation zone near $0.006. Volume has expanded on the breakout candle.
The Fibonacci retracement is anchored between the July 2025 high at $0.046608 and the February 2026 low at $0.005275. The first meaningful resistance sits at the 0.236 level around $0.015030.
That target represents a move of roughly 80% from current levels. Further out, the 0.382 level sits at $0.021064 and the 0.5 level at $0.025942. Both unlock if the altcoin tape holds.
A daily close back below $0.007 would invalidate the breakout and reopen the accumulation range.
RSI Breakout Confirms Momentum Shift
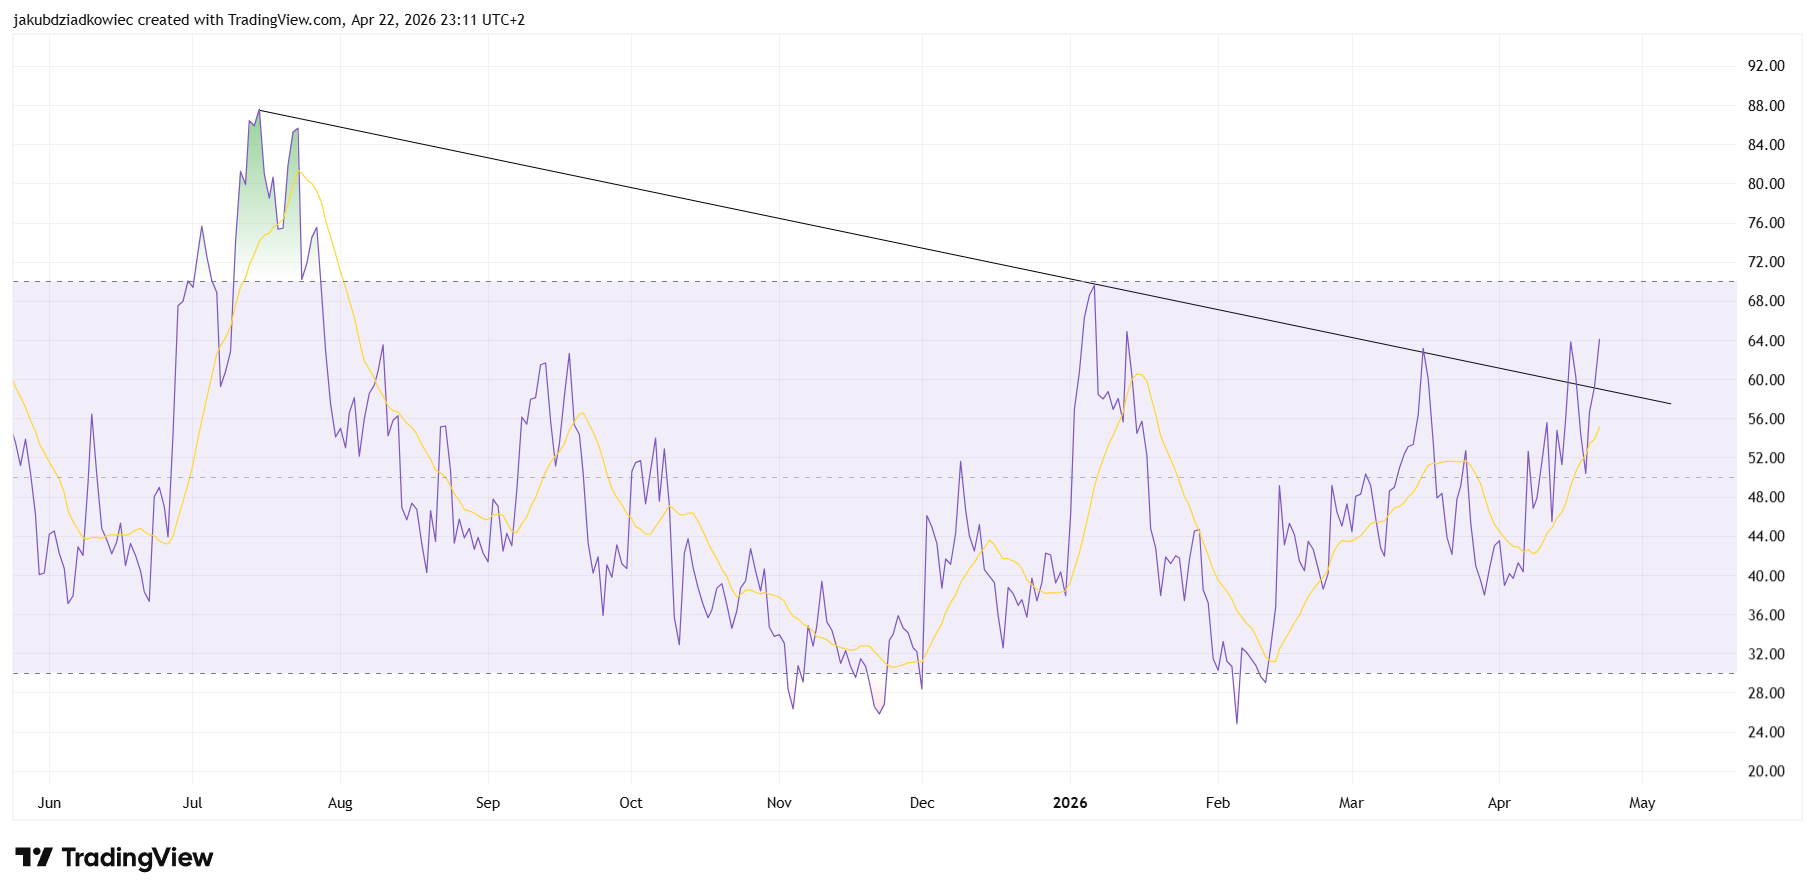
The daily RSI on PENGU broke above a descending trendline dating back to July 2025. That line tracked every lower high through early 2026.
The reading now sits near 64, well above the 50 neutral line and approaching the 70 overbought threshold. Momentum rarely flips before conviction returns, and the moving average on the indicator has started curling upward at 54.
RSI trendlines often lead price trendlines by several sessions. To invalidate the signal, RSI would need to slip below 50 and retest the broken descending line from above.
Six-Hour Chart Shows Volume-Backed Support Reclaim
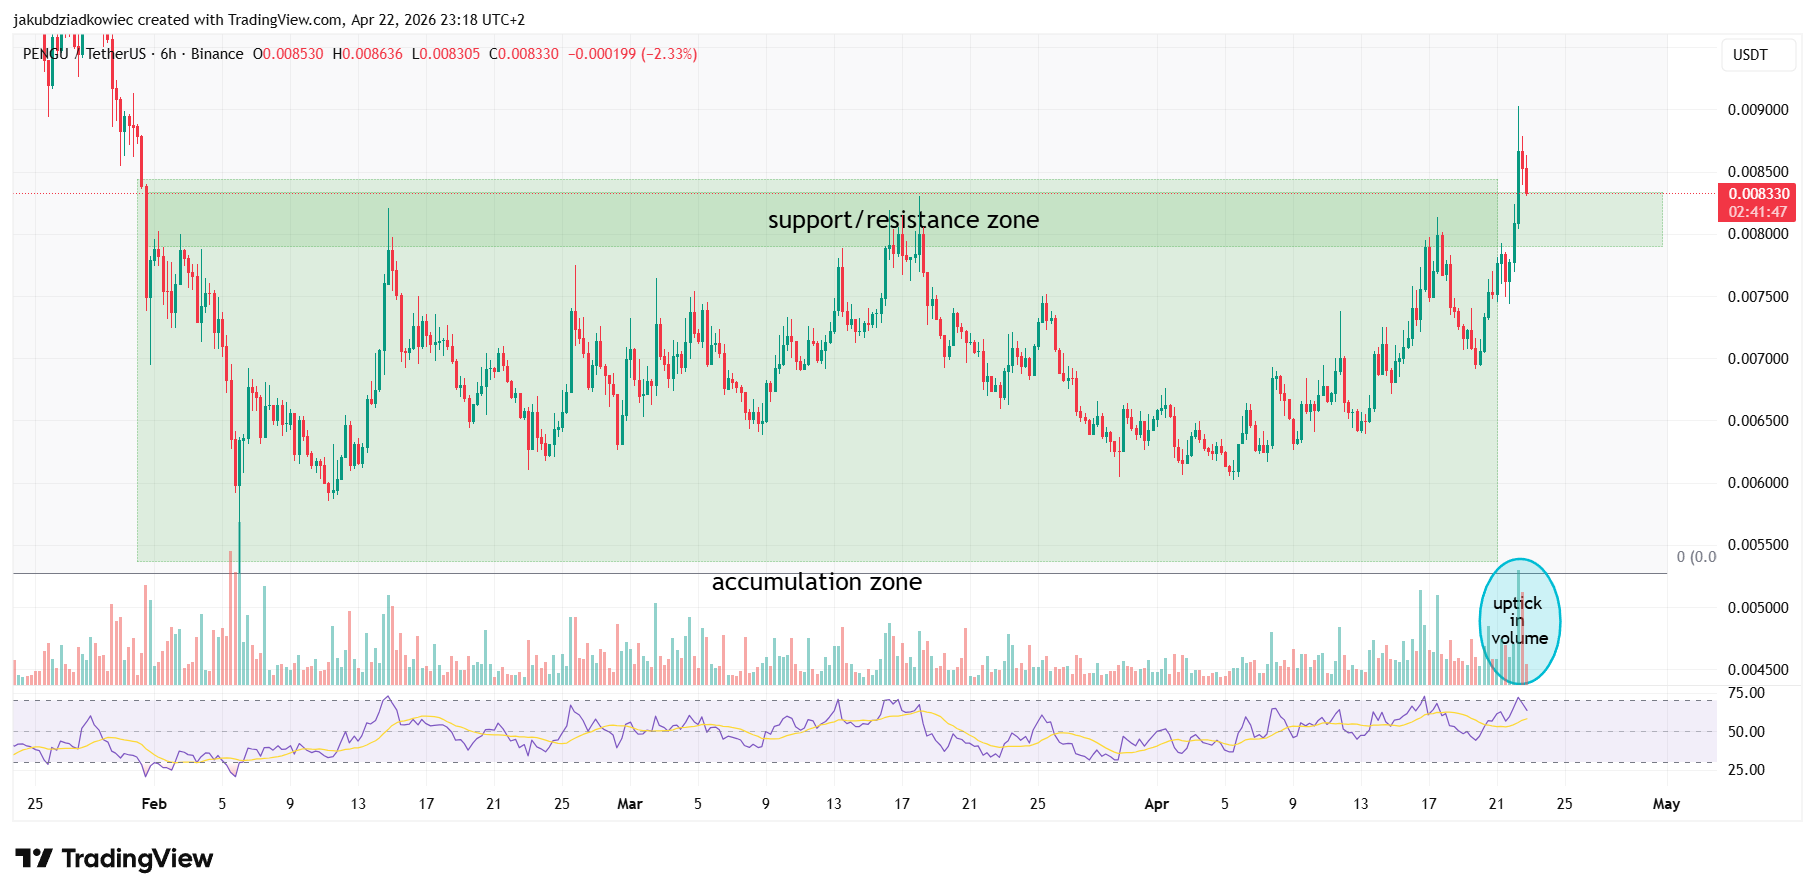
Zooming in, the six-hour chart shows PENGU clearing its $0.008 support zone on the strongest volume bar in months. The reclaim came after a two-month accumulation range between $0.006 and $0.008.
Price currently trades near $0.008330 on Binance. The short-term RSI sits around 65, with the moving average tracking higher and confirming the momentum expansion.
The six-hour structure now flips the prior resistance band into support. A drop back inside the range would weaken the setup; however, holding above $0.008 keeps the short-term bias tilted higher.
Berachain Pattern Echoes PENGU Setup as Sector Risk Lingers
While PENGU is the cleanest setup, the pattern is not isolated. Recently BERT token printed a near-identical structure on the daily timeframe.
The token broke its own descending line after a similar nine-month drawdown, rallying 4% on the same session. Two correlated microcap breakouts do not guarantee direction, however, they do hint at sector rotation.
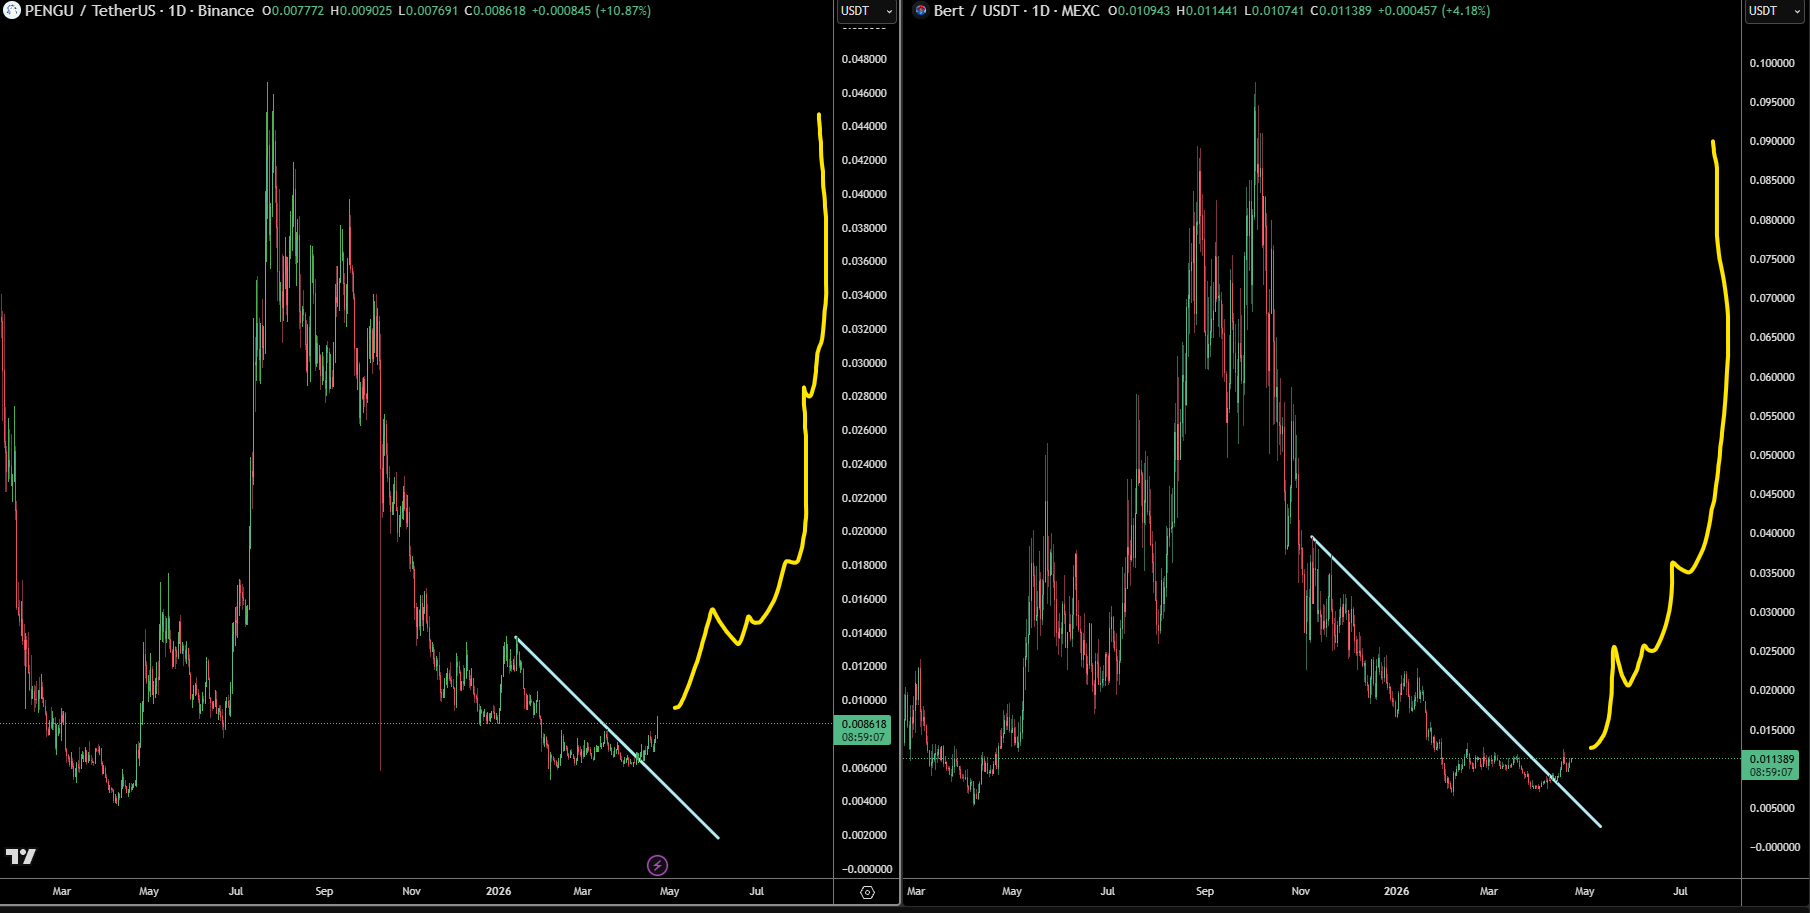
Capital appears to be cycling back into smaller altcoins after an extended period of Bitcoin (BTC) outperformance. The risk here is sector-wide.
If BTC dominance resumes its uptrend, both breakouts risk failing in tandem. Traders watching PENGU should therefore keep one eye on the Bitcoin dominance chart.
The post Pudgy Penguins (PENGU) Breaks Downtrend With 80% Rally Toward $0.015 appeared first on BeInCrypto.
Markets,Altcoin Analysis,Meme Coin Analysis,Technical Analysis#Pudgy #Penguins #PENGU #Breaks #Downtrend #Rally1776926449
