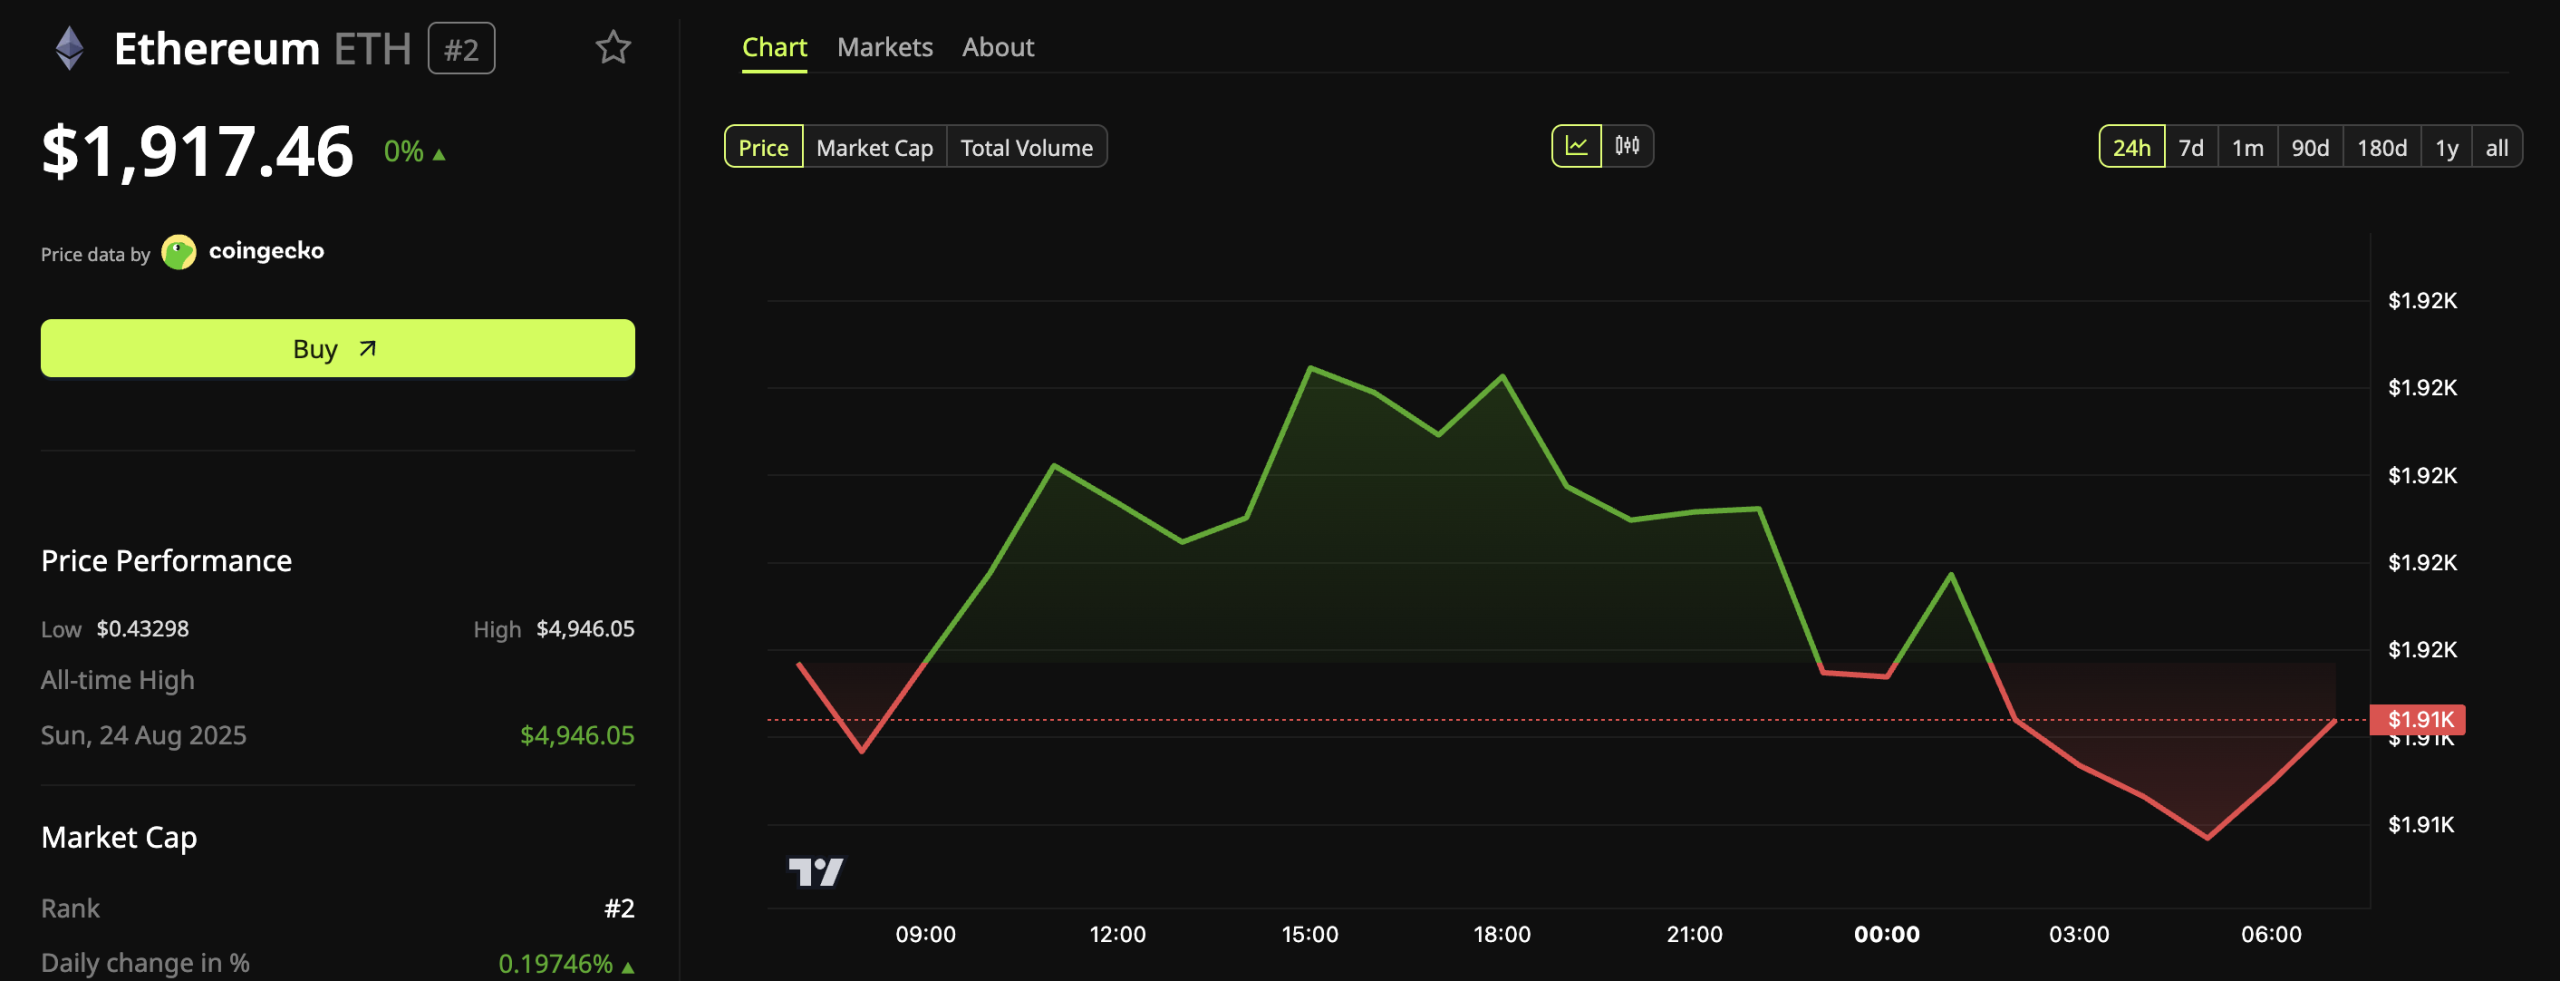

Ethereum (ETH) is tightening from several directions at once, with coins leaving exchanges, staking absorbing supply, and stablecoin liquidity rotating onto its rails. Yet, the price sits still near $1,900.
The setup has drawn attention from onchain analysts. The read points to a market quietly repositioning, while the chart shows little.

Supply Squeeze Building Beneath a Flat Ethereum Price Chart
Ethereum balances held on exchanges have fallen through 2026. CryptoQuant data shows aggregate exchange reserves down to 15.12 million ETH, from 16.86 million in January.
That marks a decline of roughly 1.74 million ETH, close to 10% of the balances available to sell.

At the same time, large-holder movement, measured through top-10 inflow and outflow volumes, is running below recent averages.
Staking has climbed above 34% of the circulating supply. In addition, validator exit queue sits near zero. Thus, holders are choosing to keep it staked rather than sell.
Exchange-traded funds are removing supply as well. Spot ETH funds drew about $482 million over the four weeks to August 7, with the final week alone adding roughly $245 million. Cumulative net inflows now sit near $11.46 billion, according to SoSo Value data.
New smart contract deployments have also risen sharply. The result is a widening gap between shrinking available supply and expanding onchain usage.
Independent data reinforces the picture. Analyst Tanaka noted weekly transaction activity above 20 million, near historical highs.
An analyst noted that similar conditions, where exchange liquidity thins as network activity builds, have led to sharper price moves in the past once demand picks a direction. He cautioned that the pattern provides no timing signal on its own.
Where the Dollars Are Moving
The liquidity side tells a parallel story. CryptoOnchain highlighted that over the past 14 days, total stablecoin netflows to Binance averaged around $87 million per day, but the composition shifted sharply.
Tether (USDT) on Tron (TRX) has drained fast. Binance’s Tron-based USDT reserves fell from about $1.4 billion to $709 million in roughly two weeks.
Ethereum-based stablecoins moved the other way. USDT on Ethereum saw weekly netflows rise 210%, while USD Coin (USDC) inflows climbed 114% over the same period.
The signal is not capital leaving the market. It is capital choosing which network to sit on, with market makers favoring deeper liquidity on Ethereum.
“Large holders and market makers may be shifting collateral away from Tron and toward Ethereum, potentially reflecting a preference for deeper DeFi liquidity, broader Ethereum-based market infrastructure, or positioning ahead of Ethereum-centric volatility,” the post read.
The Trigger Has Not Fired
ETF inflows have been steady in the past few weeks, yet they have not moved the price. That points to offsetting supply reaching the market, or to conviction too thin to force a breakout.
At the same time, spot buying on US venues remains weak. The Coinbase Premium Index, which tracks US spot strength relative to offshore venues, has held negative since early May and sits near -0.069.

Meanwhile, analyst Michaël van de Poppe described the price picture as unchanged, with ETH stuck between $1,800 and $2,000 and volatility near multi-year lows. A clean break above $2,000, he suggested, could open a stronger move.
Whether that break comes depends on demand firming, which the data does not yet show. The setup can also persist, as a tighter supply alone does not force a move.
Subscribe to our YouTube channel to watch leaders and journalists provide expert insights
The post Ethereum Price Risk: Fewer Coins to Sell and More Dollars in Position appeared first on BeInCrypto.
Markets,Cryptocurrency Market News,Editor’s Pick,Ethereum (ETH) News#Ethereum #Price #Risk #Coins #Sell #Dollars #Position1786272524