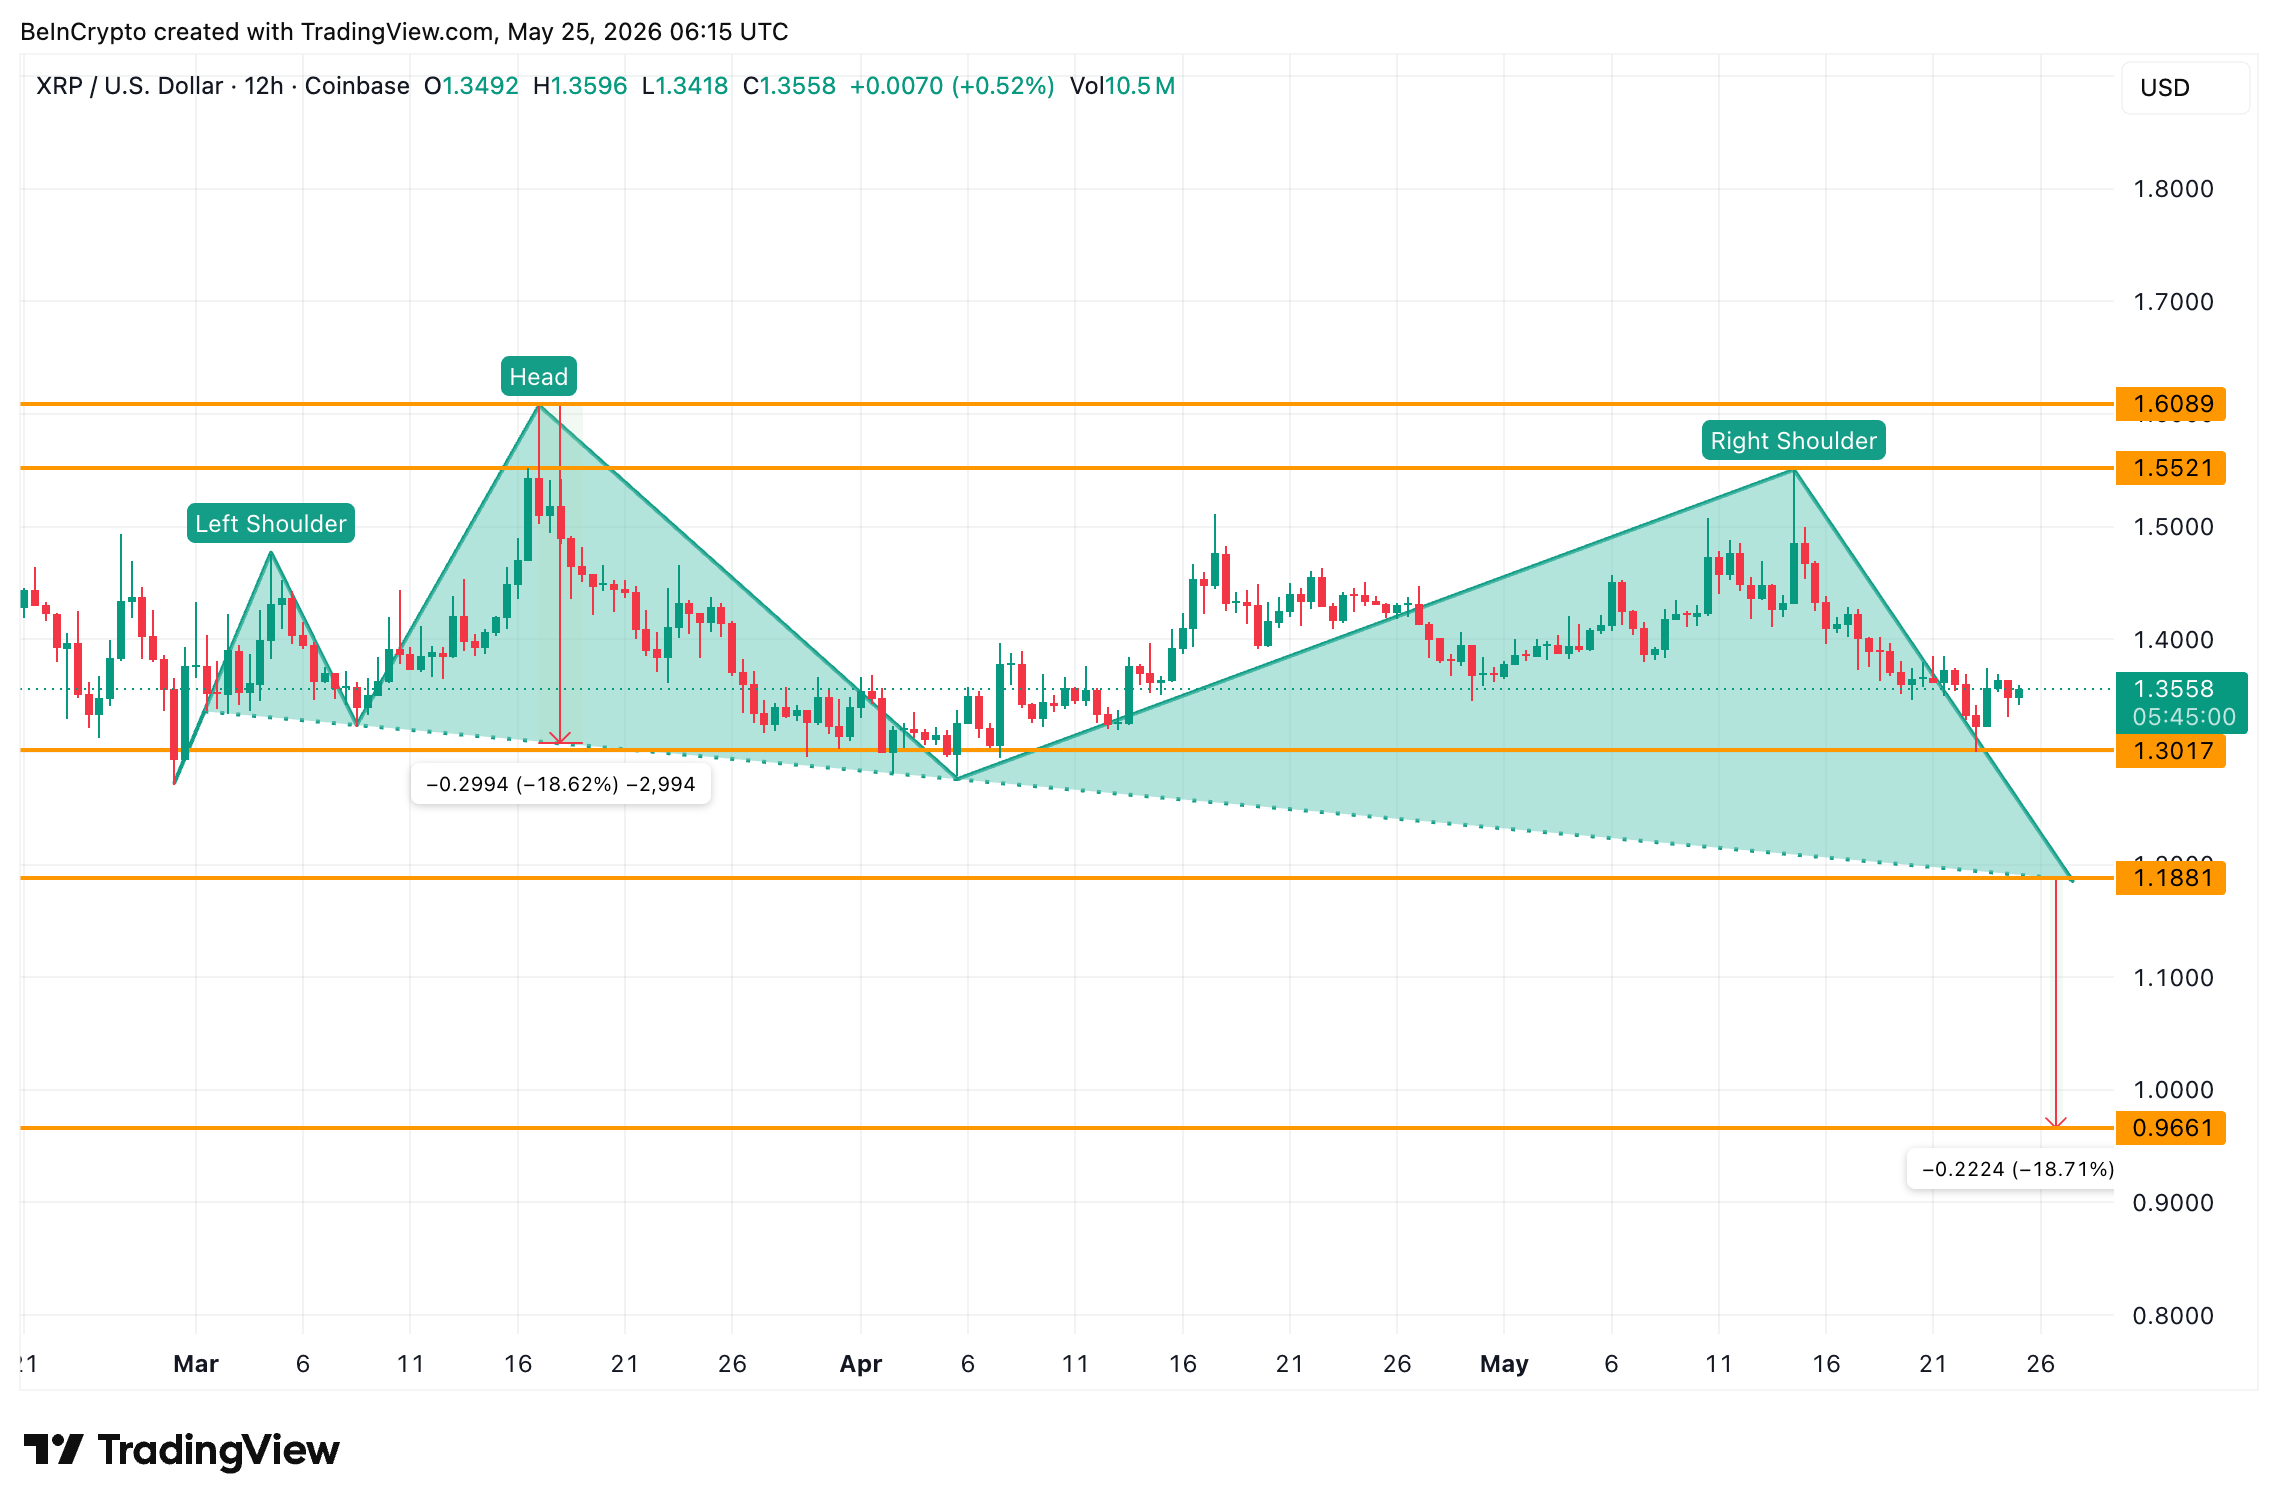

XRP price faces a bearish head and shoulders pattern that risks an 18% drop below $1. Yet, exchange outflows have surged over 300% since mid-May. Plus, open interest dropped, and long leverage hit multi-week lows.
The surging buying pressure could keep XRP range-bound for now, but a move below the neckline confirms the breakdown scenario.
Bearish Head and Shoulders Pattern Risks an 18% Drop
XRP’s 12-hour chart paints a bearish head and shoulders pattern. The left shoulder formed in early March, followed by the head peak in mid-March. The right shoulder completed in mid-May, mirroring the left shoulder structure.
Want more token insights like this? Sign up for Editor Harsh Notariya’s Daily Crypto Newsletter here.
The neckline sits around $1.18, with the bearish pattern breathing down XRP’s neck. XRP dropped to $1.30 on May 23 before a quick rebound. The risk stays alive until XRP reclaims levels above the right shoulder and head.

A measured move from the neckline projects roughly an 18% drop for XRP price. But will the breakdown happen? On-chain and derivatives data tell a different story.
Buying Pressure Quadruples as Exchange Outflows Surge 300%
The bearish XRP chart pattern faces strong on-chain pushback. Glassnode’s Exchange Net Position Change metric, which tracks exchange flows, shows XRP outflows accelerating since mid-May.
On May 15, the metric read -7,144,942 XRP. By May 24, the reading dropped to -29,372,431 XRP. That marks a 300%+ surge in outflows over nine days.
Net exchange outflows signal accumulation off-exchange. Coins moving out reduce available supply for immediate sale, easing downside pressure. The trend has been steady rather than spiky, pointing to a deliberate buying campaign.

Whether this buying pressure can save XRP price from falling below $1 depends on its persistence. A sustained outflow trend could absorb the supply driving the breakdown, turning the setup into a tug of war. Derivatives data adds further weight to this counter-argument.
Long Leverage Drains as XRP Price Faces Range-Bound Stalemate
Derivatives data reinforces the range-bound thesis. Santiment data shows XRP open interest dropped from $1 billion to $914.19 million since May 15. Total funding rates on long positions also dropped from 0.008% to 0.003%.
The 62% drop in long funding rates reduces the risk of cascading long liquidations. Less long leverage means less downside fuel for a breakdown. Combined with the buying pressure, the breakdown thesis weakens.

XRP trades at $1.35 on May 25 with the chart still in the bearish setup. A move below $1.34 followed by $1.28 increases drop risk. A bigger weakness emerges below the $1.21 and $1.18 levels.
A 12-hour close below $1.18 would push XRP price to $1.01 and even $0.96. That marks a sub-$1 fall and confirms the head and shoulders breakdown. The 1.618 Fibonacci level at $1.01 acts as a key bearish target.

A reclaim above $1.55 weakens the bearish bias and opens a path back to $1.60. A 12-hour close above $1.60 fully invalidates the head and shoulders pattern.
XRP price sits at a crossroads where chart bearishness meets on-chain bullishness. The data points to a tense range-bound period for now. A sustained sub-$1 drop requires the buying pressure to fade and long leverage to return.
The post XRP Exchange Outflows Surge 300%. Is It Enough to Save the Chart? appeared first on BeInCrypto.
Trading,Altcoin Analysis,Editor’s Pick,Ripple (XRP) Analysis#XRP #Exchange #Outflows #Surge #Save #Chart1779730115