
Ethereum price plunged towards the $1,500 level after a wave of long liquidations, persistent ETF outflows, and worsening macroeconomic conditions triggered one of the sharpest crypto selloffs of 2026.
Summary
- Ethereum price plunged to around $1,500, extending weekly losses to 23% amid a market-wide liquidation event and worsening macro conditions.
- Spot Ethereum ETFs saw $540 million in outflows in May, and another $168 million left the funds in early June, adding pressure on prices.
- Analysts warn a break below $1,400 could expose ETH to a deeper decline toward the $1,000-$1,100 region.
According to data from crypto.news, Ethereum (ETH) price fell over 10% to an intraday low of around $1,505 on June 6 before stabilizing near $1,540 at press time. The decline extended losses to roughly 23% over the past week and pushed ETH to its lowest level since early 2023 as investors fled risk assets across both crypto and traditional markets.
Selling accelerated after Bitcoin briefly slipped below the key $60,000 support level, triggering a market-wide liquidation event. Derivatives data showed nearly 78.7% of liquidations over recent sessions came from long positions, while Ethereum open interest dropped by almost 30%, highlighting a sharp reduction in leveraged bullish bets.
At the same time, institutional demand continued to deteriorate. Per SoSoValue data, U.S. spot Ethereum ETFs recorded approximately $540 million in net outflows during May, with another $168 million leaving the products during the first week of June. The sustained withdrawals removed a major source of demand from the spot market and added pressure on ETH as prices broke below several key technical levels.
Macroeconomic conditions added another layer of stress. A stronger-than-expected U.S. labor report reduced expectations for Federal Reserve rate cuts, while renewed military tensions between the United States and Iran pushed Brent crude toward $97 per barrel.
Rising oil prices revived inflation concerns and prompted investors to move capital into defensive assets and large-cap technology stocks rather than cryptocurrencies.
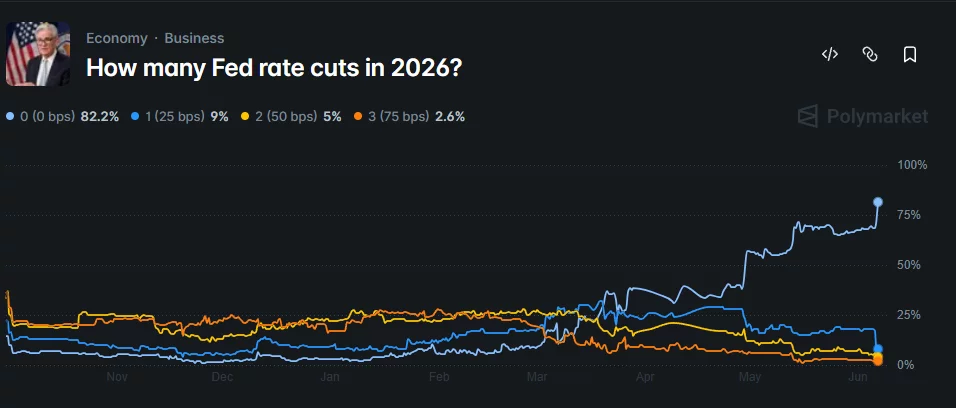
Prediction market participants have also scaled back expectations for Federal Reserve easing. Polymarket data recently showed traders assigning a roughly 82.2% probability that the Federal Reserve will not cut interest rates during the remainder of 2026, a scenario that could keep liquidity conditions tight for risk assets.
Ethereum breakdown opens path toward $1,000 support zone
Technical charts show Ethereum breaking below a rising support trendline that had previously acted as the foundation of several recovery attempts since February. The breakdown completed a bearish continuation structure and sent ETH directly toward the $1,550 support region identified by multiple analysts.
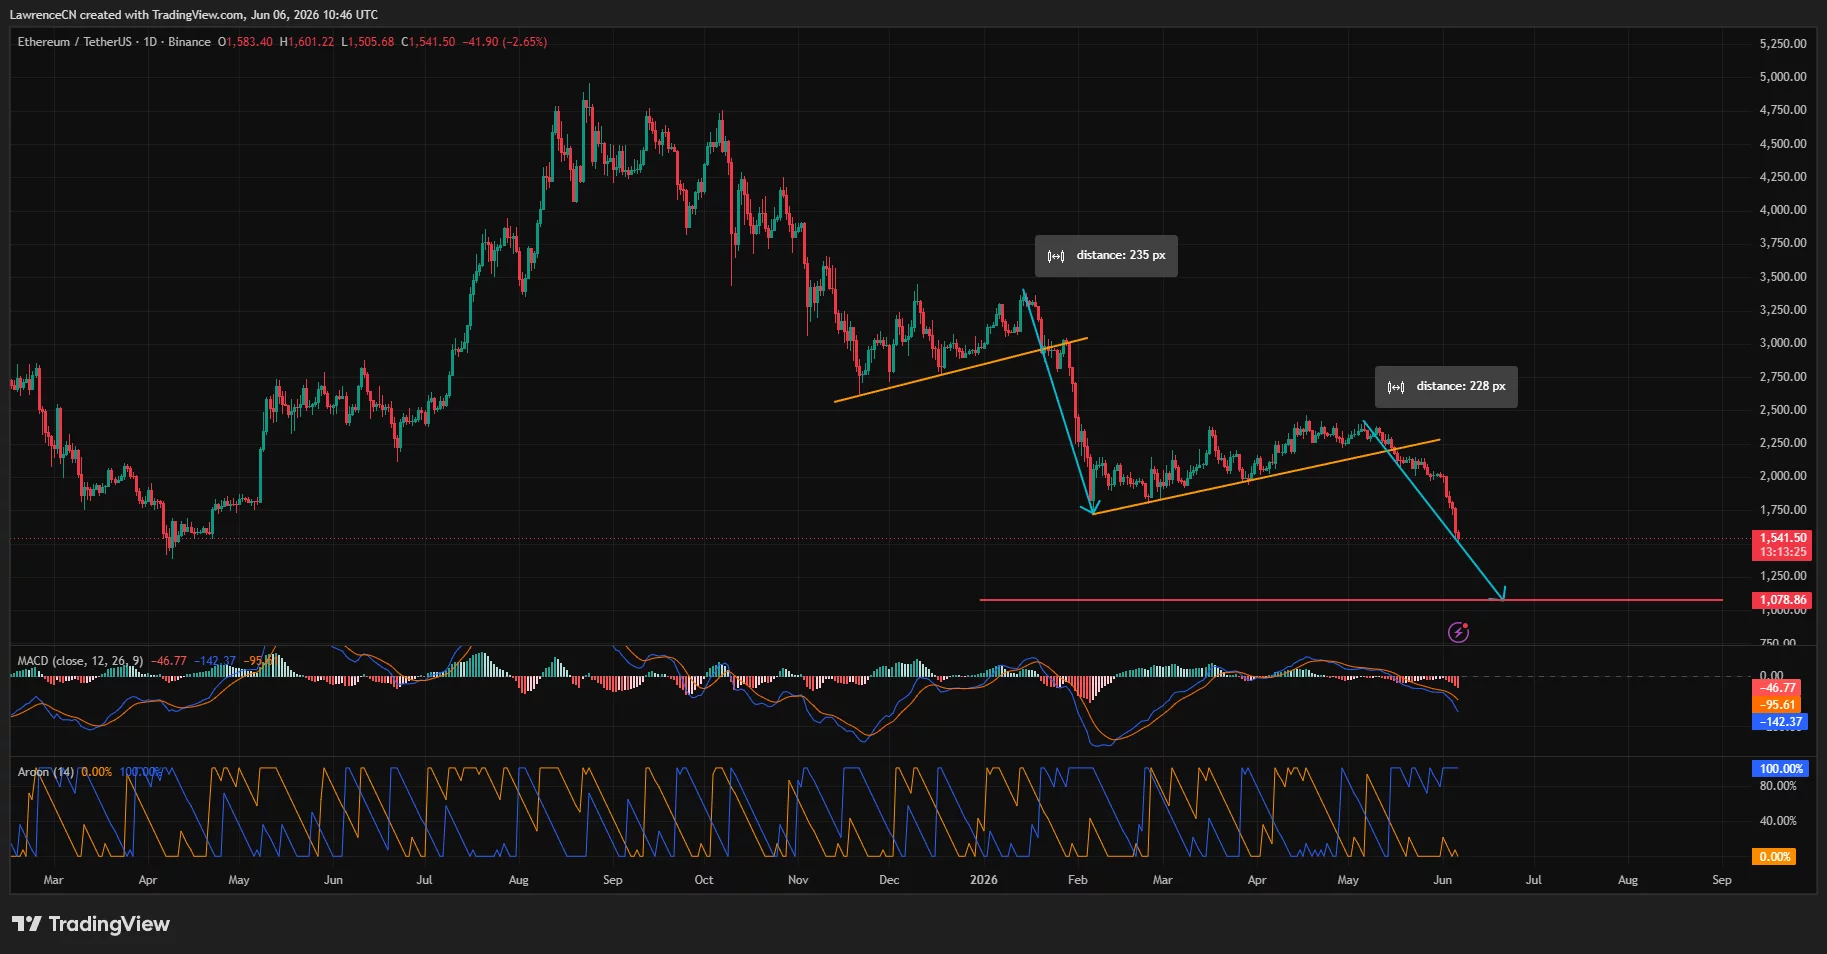
According to crypto analyst Ali Martinez, Ethereum has already reached his first downside objective.
“Ethereum $ETH hit my first target at $1,560. Next target: $1,070.”
A separate analysis from More Crypto Online argues that Ethereum remains in a larger corrective decline. The firm noted that support sits near $1,550 and $1,400, while any recovery attempt is likely to face resistance at the broken trendline that previously supported the market.
Momentum indicators continue to favor sellers. The daily MACD remains deeply negative, while the Aroon indicator shows bears maintaining full control of the prevailing trend. Meanwhile, Ethereum has fallen well below its 200-day moving average after losing the psychologically important $1,800 level earlier this week.
On-chain activity has weakened alongside the price action. Ethereum network fees have fallen roughly 45% from recent highs, while large holders have continued reducing exposure during the latest decline. The drop in network activity coincides with reduced speculative demand across decentralized finance and derivatives markets.
Key risks remain tied to leverage, ETF flows and macro conditions
Liquidation data suggests downside volatility could persist if Ethereum loses the $1,400 support area. Several analysts have identified the $1,000-$1,100 region as the next major historical demand zone should current support levels fail to hold.
Additional pressure could emerge from decentralized finance markets. Estimates suggest roughly $547 million in lending positions may face liquidation if Ethereum extends its decline, creating another potential source of forced selling.
A recovery scenario would require Ethereum to reclaim the broken trendline resistance and recover the $1,800 area, which previously served as a major support level. ETF flows also remain critical. Continued institutional withdrawals would likely limit any rebound attempt, while a return of inflows could help stabilize market conditions.
Crypto sentiment remains firmly bearish for now. The Crypto Fear & Greed Index recently fell to 11, its lowest reading in Extreme Fear territory, underscoring the depth of investor pessimism as Ethereum tests support levels not seen in more than two years.
Disclosure: This article does not represent investment advice. The content and materials featured on this page are for educational purposes only.
Markets#Ethereum #price #touches #market #crash #deepens #analyst #flags #risk1780744588
